
Figure 1.
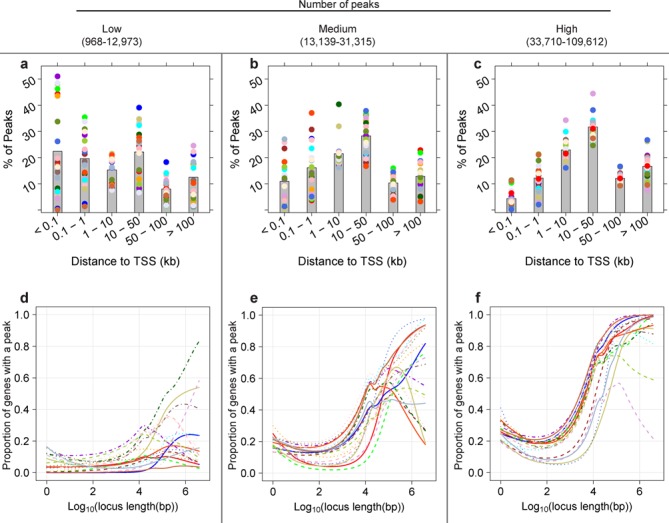
Gene locus length-to-peak presence relationship becomes stronger as the total number of peaks increases. The relationship between gene locus length and proportion of genes with ≥1 peak in a gene locus varies widely in 63 ENCODE ChIP-seq data sets, from no relationship to strongly positive. DNA-binding proteins (DBPs) from the GM12878 cell line were categorized into three groups of 21 DBPs by the total number of peaks. For each DBP, the relationship between log10 locus length and proportion of genes with a peak was modeled using a binomial cubic smoothing spline (see the Materials and Methods section). (a)–(c) Bar plots show the average proportion of peaks present within the specified distance from the TSS (kb) (gray bar) and the proportions for individual DBPs (colored dots, the same color as the line in the corresponding plot). DBPs with fewer peaks tend to have a higher proportion of binding close to TSSs. (d) The locus length-to peak presence relationship tends to be weak for data sets with few peaks. (e) and (f) The relationship becomes strongest when the number of peaks is highest (f). None of the DBPs in (d), two of the DBPs in (e) and 10 of the DBPs in (f) are histone modifications.