
Figure 1.
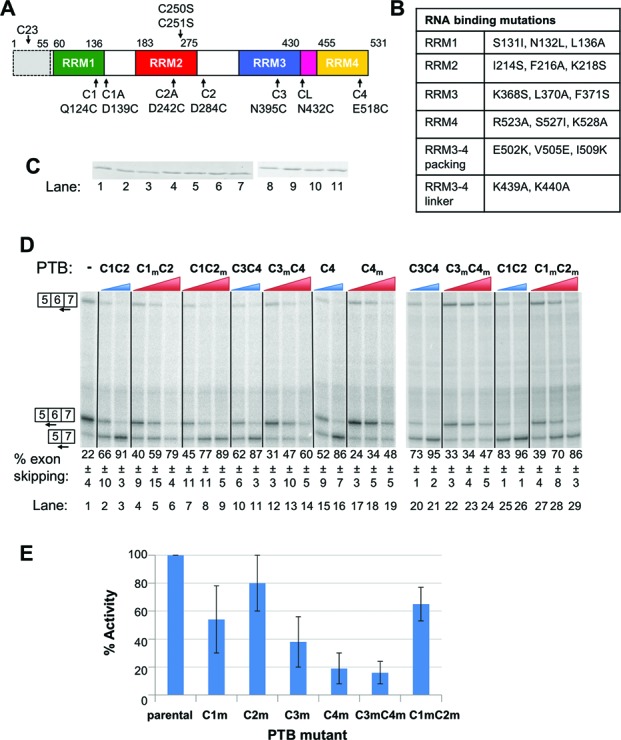
Differential effects of RRM mutations upon PTB activity. (A) Schematic representation of recombinant PTBs used for tethered hydroxyl radical probing. Boundaries of RRMs and positions of cysteines in native PTB1 are shown above. All constructs used here had amino acids 1–55 deleted (shown by grey shading dashed outline) and C250/251 mutated to serine to generate the ‘Cys-less’ parental construct. Positions of mutations to generate single or double cysteine mutants are shown below. All data shown are derived from the C1, C2, C3, CL and C4 mutations, individually and in combination as indicated. (B) Identity of additional mutations designed to impair RNA binding or RRM packing. The mutations in RRMs 1, 2, 3 and 4 were those previously found to be the most effective combinations for inactivating the RNA-binding potential of each RRM (mutation groups m, b, f and k from (18)). Note that the nomenclature used here for the PTB constructs differs from that in (18). (C) Coomassie-stained SDS PAGE of recombinant proteins used in panel D. Proteins are loaded in the same order as in panel D, i.e. lane 1, C1C2… lane 11, C1mC2m. All proteins migrate at the same size; lanes 1–7 and 8–11 are not adjacent lanes on the same gel. (D) FAS WT RNA was spliced in vitro in HeLa nuclear extract in the absence (lane 1) or presence (lanes 2–29) of recombinant PTB. PTB was added to 10 and 30 ng/μl (WT single and double cysteine mutants, blue wedges), or 10, 30 and 60 ng/μl (RRM mutants, red wedges). Specific splicing products were detected by primer extension with an end-labeled primer. The percent exon skipping, calculated as 100*5–7/(5–7 +0.5(5–6 + 6–7)), shown below each lane is the average ± SD of three replicates. Proteins are named by the RRM domain(s) containing the cysteine substitutions (C1C2, C3, etc.). The subscript ‘m’ indicates an RNA binding mutation (details in panel B) in the associated RRM. For example, C1C2m has the Q124C and D284C substitutions in RRMs 1 and 2, respectively, and the I124S, F216A, K218S RNA binding mutations in RRM2. (E) The % activity of each of the RRM mutants compared to the parental single or double cysteine mutant was calculated for the 30 ng/μl concentrations in panel A: % activity = 100*(%exon skipping mutant PTB − % skipping no PTB) / (%exon skipping WT PTB − % skipping no PTB). For example, for the C1mC2 mutant % activity was calculated using the values from lanes 1, 3 and 5 of panel D as 100*(59–22/91–22) = 54%. Error bars are based on the SD of the values in panel D for the mutant and WT proteins.