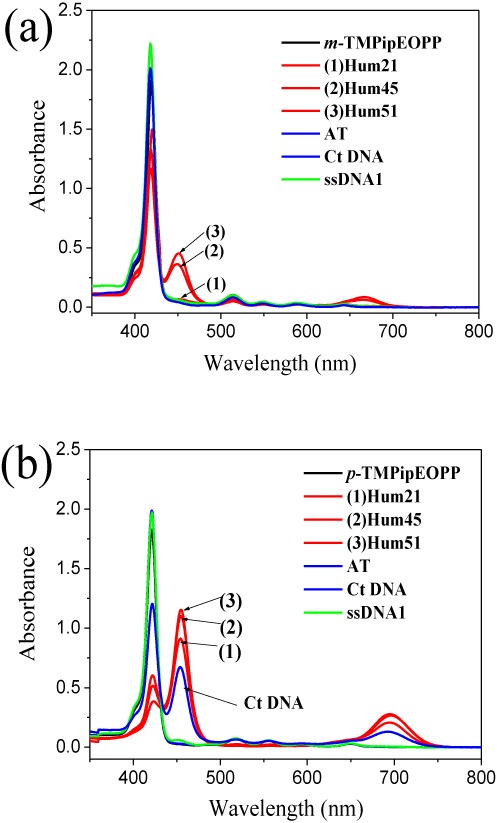
Figure 1.

UV-vis absorption spectra of m-TMPipEOPP (a) and p-TMPipEOPP (b) in absence or presence of different DNAs. Free porphyrin (black line); G-quadruplex (red line); duplex DNA (blue line); single-stranded DNA (green line). [Porphyrin] = 2.5 μM; [multimeric quadruplex] = 10 μM; [monomeric quadruplex] = [duplex DNA] = [single-stranded DNA] = 20 μM; [Ct DNA] = 1200 μM (base concentration). The effects of other DNAs on the absorption spectrum of m-TMPipEOPP were shown in Supplementary Figure S4.
