
Figure 2.
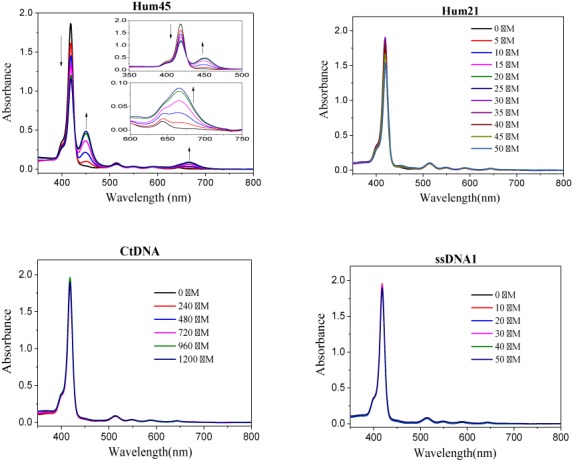
DNA concentration-dependent absorption spectrum changes of m-TMPipEOPP in the presence of multimeric G-quadurplex Hum45, monomeric G-quadruplex Hum21, duplex Ct DNA or single-stranded ssDNA1. The concentrations of Hum45 are (arrow direction): 0, 2.5, 5, 10, 15 and 20 μM. The concentrations of other DNAs are labeled in the figures. Except the concentration of Ct DNA is represented as base concentration, other DNAs are all represented as single-stranded concentration. DNA concentration-dependent m-TMPipEOPP spectrum changes in the presence of other DNAs can be found in Supplementary Figures S5–S9.