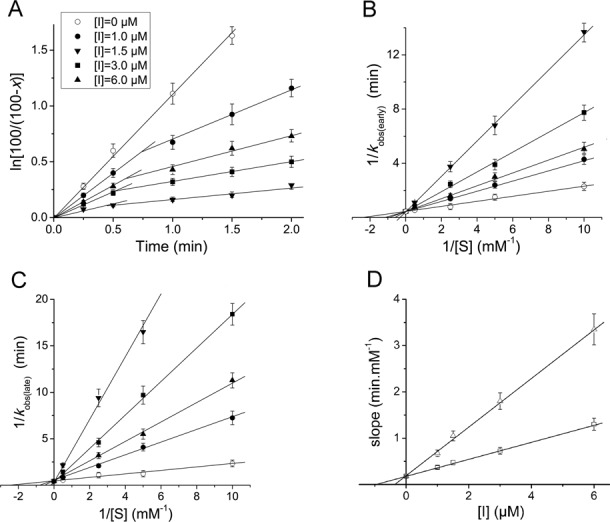
Figure 2.

Kinetic plots for the AcPhe-puromycin synthesis in the presence or absence of PA–CAM conjugate 4. (A) First-order time plots; complex C reacted at 25°C in buffer A, with (open circles) 400 μM puromycin or with a mixture containing (total concentration) 400 μM puromycin and compound 4 at (filled circles) 1 μM, (up-standing, filled triangles) 1.5 μM, (filled squares) 3 μM and (down-standing, filled triangles) 6 μM. The deviation from linearity observed in the presence of compound 4 reveals a time-dependent inhibition effect. (B and C) Double-reciprocal plots; the data shown were collected from the early and the late phases of semi-logarithmic plots, respectively, such as those presented in panel A. Drug concentrations are denoted by the same symbols, as those used in panel A. (D) Slope replots (slopes of the double-reciprocal plots versus compound 4 concentration). The slope values were estimated from the plots shown in (open squares) panel B or (open triangles) panel (C). The plots presented in panels B, C and D indicate that the inhibition at both phases is of competitive type and that only one ribosomal binding site is implicated at each phase of the inhibition process.
