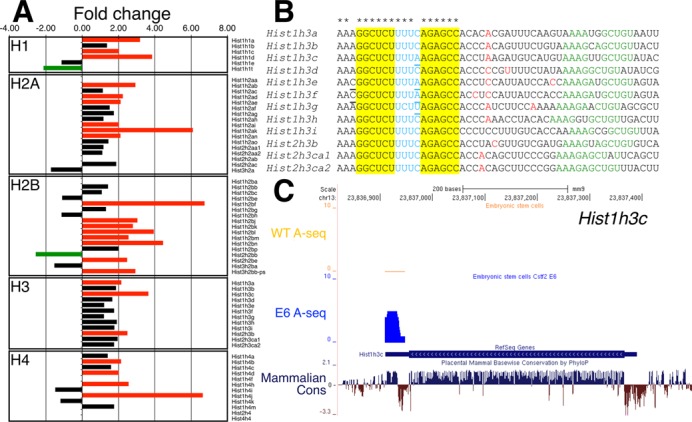
Figure 3.

Increase in the polyadenylation of replication-dependent histone mRNAs in Cstf2E6 cells. (A) Fold change of the polyadenylated replication-dependent histones families in the Cstf2E6 ESCs versus wild type ESCs. Green bars indicate 2-fold or more down-regulation, red bars—2-fold or more up-regulation and black bars no change (<2-fold) of the expression of the polyadenylated histone mRNAs. (B) Cleavage and polyadenylation sites in the replication-dependent histone H3 family. Alignment of the stem-loop region, 3′ end processing cleavage site and downstream genomic sequences. Red nucleotides indicate the 3′ end cleavage and polyadenylation sites as determined by A-seq in wild type ESCs and Cstf2E6 cells. The stem-loop region of the H3 histone mRNAs are highlighted in yellow and blue, respectively. Underlined nucleotides indicate the different nucleotides from the consensus sequence. Asterisks at the top of the alignment point out to the consensus sequence of the stem-loop. Green nucleotides show the respective HDE sequence (AAAGAGCUGU). (C) A-seq reads mapped to the mouse genome (mm9) for wild type and Cstf2E6 ESCs. Position of the Hist1h3c is shown in the RefSeq Genes track. The blue peak above the RefSeq Genes track is the number of non-normalized reads uniquely mapping to histone Hist1h3c obtained from A-seq for the Cstf2E6 cells overlapping with the stem-loop region. Above in orange—A-seq reads obtained from the wild type ESCs. The sequence conservation of Hist1h3c in placental mammals is shown at the bottom of the figure.
