
Figure 3.
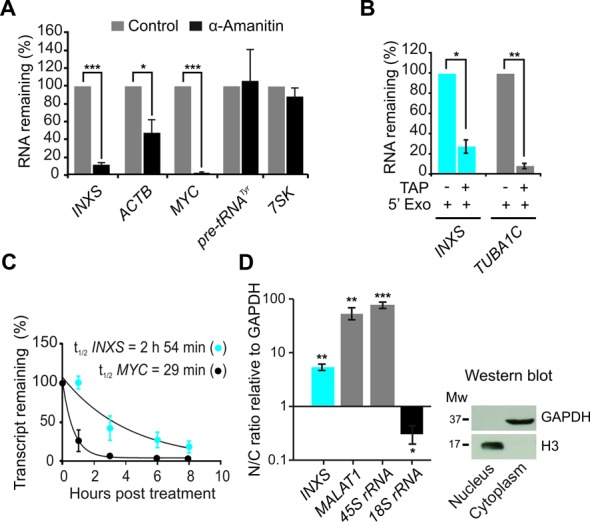
Characterization of INXS biogenesis, stability and cellular localization. (A) RNAPII inhibition with α-amanitin decreases the levels of INXS. Known RNAPII-transcribed (ACTB, MYC) and RNAPIII-transcribed genes (pre-tRNATyr, 7SK) were assayed as controls. (B) The presence of a 5′-end cap modification in INXS was determined by digestion with terminator 5′-phosphate-dependent exonuclease (5′Exo) in combination with tobacco acid pyrophosphatase (TAP), as indicated. TUBA1C tubulin gene was assayed as a control. (C) INXS decay rate in cells treated with actinomycin D, a transcription inhibitor. MYC was measured in parallel as a positive control of the decay assay. (D) Relative distribution of INXS in the nuclear and cytoplasmic fractions (N/C ratio). The nuclear-enriched MALAT1 lincRNA and the 45S rRNA were used as nuclear fraction controls and the 18S rRNA as a cytoplasmic fraction control. As an additional control, western blot of the protein extracts from the fractions was performed, detecting GAPDH only in the cytoplasmic fraction, and histone H3 only in the nuclear fraction. Further controls for cell fractionation are described in the Supplementary Data. *(P <0.05), **(P <0.01) and ***(P <0.001).