
Figure 8.
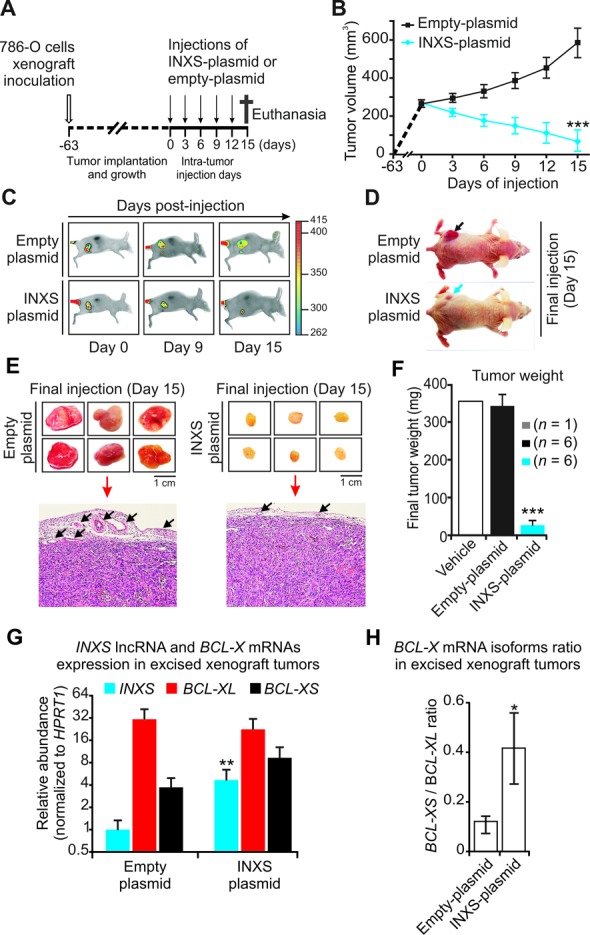
Overexpression of INXS induces tumor regression in vivo. (A) Schematic representation showing the subcutaneous inoculation of mice with 786-O human kidney tumor cells (open arrow, on day –63), followed by a waiting period until all the tumors had implanted and grown to reach the approximate same volume of 250 mm3 (on day zero), when the injection of animals began (vertical arrows). Intra-tumor injections of INXS-plasmid or empty-plasmid were performed every third day over a period of 15 days. (B) Tumor volume was monitored by caliper on the days of injection in six different animals from each of two groups, which were injected either with INXS-plasmid (blue) or control empty-plasmid (black). The data are the mean ± SD of measurements from the six animals of each injection group. (C) An EGF-labeled dye marker was detected in the tumor by in vivo scanning with a near-infrared optical imaging system. Only one representative mouse is shown for each group, namely, INXS-plasmid or control empty-plasmid. (D) Pictures of the scanned animals, taken on day 15; note the difference in size between the tumors of the two animals, as indicated by arrows. (E) On day 15, all six animals from each of the two groups were euthanized, and their tumors were excised and photographed. Subsequently, tumors were formalin-fixed, paraffin-embedded, stained and observed by light microscopy. Arrows point to tumor peripheral vascularization. (F) Average weights of the excised tumors for each of the two injection groups, INXS-plasmid (blue) or control empty-plasmid (black). The data are the mean ± SD of measurements from the six animals of each injection group. An additional animal whose tumor was injected with only transfection solution is shown (vehicle, white bar). (G) INXS lncRNA (blue), BCL-XL mRNA (red) and BCL-XS mRNA (black) expression levels measured by RT-qPCR in the excised xenograft tumors. (H) BCL-X mRNA isoforms ratio in the excised xenograft tumors. *(P <0.05), **(P <0.01) and ***(P <0.001).