
Figure 1.
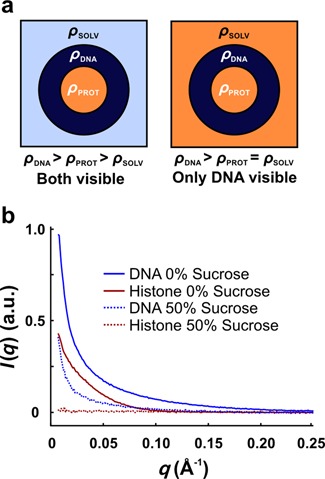
Contrast variation reveals DNA conformation within protein–nucleic acid complexes. (a) Cartoon depicting how contrast variation is used to isolate scattering from the DNA component in protein–nucleic acid complexes. Left: The protein–nucleic acid complex in solution can be approximated as three phases with electron densities ρSOLV (light blue), ρPROT (orange), and ρDNA (dark blue). Right: Because contrast arises from electron density differences, the electron density of the solvent is increased by adding small molecules such as sucrose until it matches that of the protein. Consequently, the protein is effectively ‘blanked’ and only the DNA contributes to the measured scattering signal. (b) Scattering profiles for NCP components measured separately in 2 M NaCl with and without sucrose. In 50% sucrose, proteins become invisible above the background and only the DNA contributes to the scattering. The resulting signal for the DNA is decreased because of the reduced contrast between the DNA and solvent.