
Figure 6.
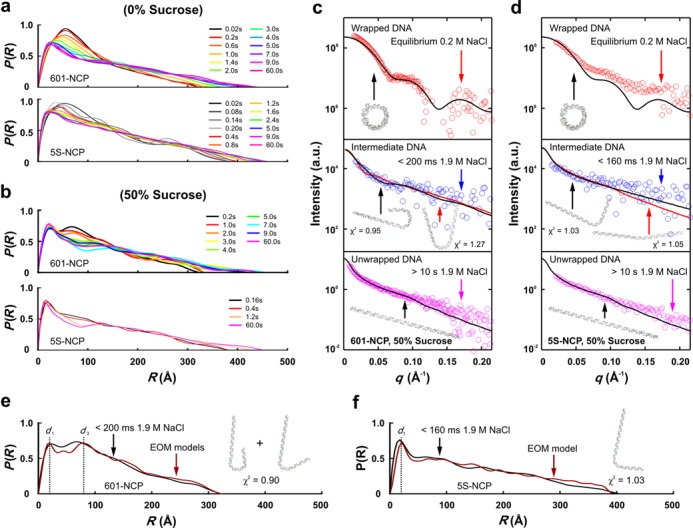
Time-resolved SAXS with contrast variation reveals DNA conformation of kinetic intermediates. (a) Pairwise distance distribution functions, P(R), computed from time-resolved scattering profiles of 601-NCP and 5S-NCP in 0% sucrose. (b) Time-resolved P(R)s for 601-NCP and 5S-NCP in 50% sucrose revealing DNA conformational changes during salt-induced disassembly. (c and d) Comparison of experimental scattering profiles for (c) 601-NCP and (d) 5S-NCP in 50% sucrose with best fitting theoretical scattering profiles for symmetric (black lines) and asymmetric (red lines) models for the wrapped, intermediate and unwrapped DNAs (offset to aid visualization). Theoretical profiles are calculated from the models shown as insets. The intermediate DNA models were determined using EOM and the goodness of fits was assessed by comparing χ2 values. (e and f) P(R)s for the ensembles (red) selected by EOM analysis (models shown with χ2 fit to SAXS data) compared with the experimental P(R)s (black) determined from (e) the 200 ms kinetic intermediate of the 601-NCP in 50% sucrose and (f) 160 ms data of the 5S-NCP in 50% sucrose (for details see Supplementary Text: Minimum Chi-square (χ2) Fit, Ensemble Optimization Method and Supplementary Figure S8).