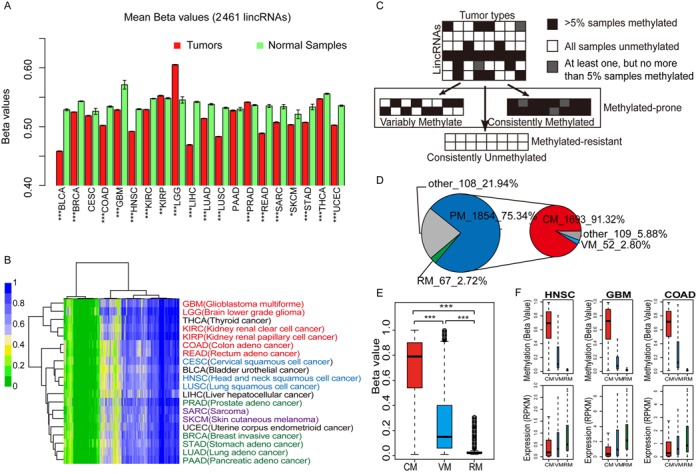
Figure 2.

Dissecting lincRNA promoter methylation patterns in cancers. (A) Bar plots with average methylation levels of lincRNA promoters in tumors and corresponding normal samples (t-test, *P < 0.05, **P < 1.0e−3 and ***P < 1.0e−4). Error bars, mean ± SEM. (B) Unsupervised hierarchical clustering of average methylation profiles for 2461 lincRNAs in 20 cancer types. GBM-LGG, KIRC-KIRP and COAD-READ were three pairs of cancers with similar tissue of origin. PRAD, BRCA, STAD, LUAD and PAAD were cancers arising from adeno. CESC, HNSC and LUSC were cancers arising from squamous cells. SARC and SKCM were sarcomatoid carcinomas. (C) Strategy used to segregate lincRNAs into sets with distinct methylation patterns. (D) Pie chart with the number of lincRNAs in different categories. (E) Box plots show methylation level of lincRNAs in different categories. Differences between sets were tested using Wilcoxon rank sum tests. (F) Box plots of DNA methylation and expression levels of VM, CM and RM lincRNAs for three cancers. Methylation and the corresponding expression values were obtained from consistent sample sets.
