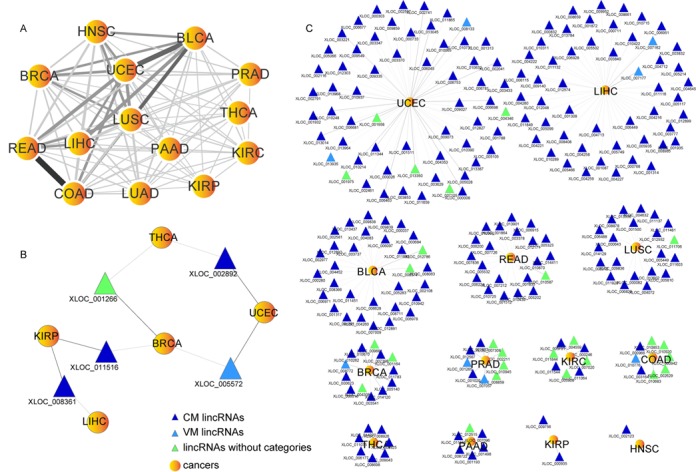
Figure 6.

AM lincRNAs in cancers. (A) Network of cancers. The width and shades of color of the edges between two cancer types correlate with the numbers of shared AM lincRNAs. (B) AM lincRNAs with altered methylation status between cancers. (C) UAM LincRNAs. Dark gray, UAM lincRNA hypermethylation in tumors. Light gray, UAM lincRNA hypomethylated in tumors.
