
Figure 2.
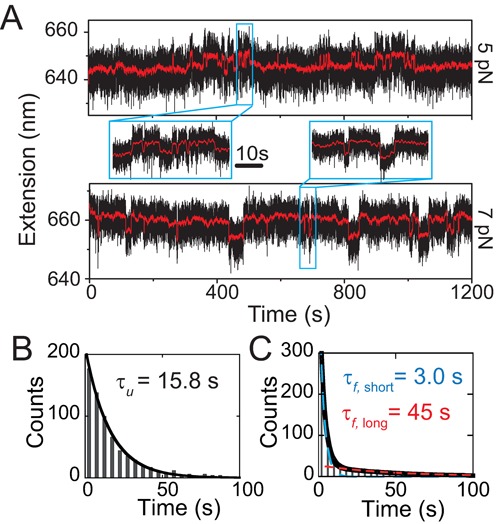
Equilibrium folding and unfolding dynamics under constant forces. (A) Representative time traces (black dots) of the extension fluctuation of a single telomeric G4 tether recorded at 5.0 ± 0.5 pN (upper panel) and 7.0 ± 0.7 pN (lower panel). The red lines show smoothed time traces by adjacent average of data using a 0.5 s sliding time window. Insets show zoom-in time traces containing rapid folding and unfolding transitions. (B) Histogram of the dwell time of the longer extension state (i.e. unfolded G4) recorded at 5.0 ± 0.5 pN, which is fitted by a single-exponential decay function with time constant of τu = 15.8 ± 0.4 s (black curve, average ± standard error). (C) Histogram of the dwell time of the shorter extension state (i.e. folded G4) recorded at the same force, which cannot be fitted by a single-exponential decay function. Therefore, a double-exponential decay function with two time constants of τf, short = 3.0 ± 0.1 s and τf, short = 45 ± 4 s was used for the fitting (black curve), which is the sum of two individual single-exponential fitting using the respective time constants. Data in panels (B) and (C) include 683 folding events and 684 unfolding events collected from 13 independent telomeric G4 DNA tethers.