
Figure 4.
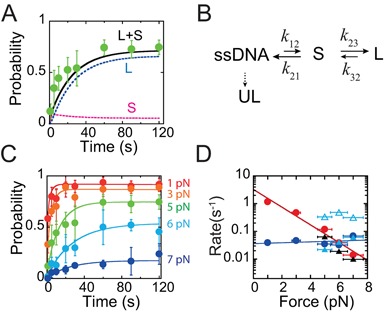
Telomeric G4 folding and unfolding kinetics and stability. (A) Green solid circles indicate experimental measured pfold(t) at 5 pN. Black curve is the predicted pfold(t) based on the sequential model in (B), which is the sum of the probabilities of the long-lived state (L, blue curve) and the short-lived state (S, purple curve). (B) Sketch of the sequential transition model, in which the long-lived state, short-lived state and ultra-long-lived state are indicated by ‘L’, ‘S’ and ‘UL’, respectively. (C) Filled circles of different colors indicate experimental pfold(t) measured at different forces. Each data point was calculated based on more than 100 refolding/unfolding cycles from at least four molecules. The solid lines with corresponding colors are best fitting based on the Master equation of the sequential model. (D) The fitted k12 (red solid circles) and k32 (blue solid circles) at different forces. The black triangles are ku → f determined in dwell time analysis at constant forces of 5, 6 and 7 pN, respectively. The open and solid cyan triangles are kf → u, short and kf → u, long of the short-lived (open triangle) and long-lived (solid triangle) states, respectively, which are directly determined by dwell time analysis. X-axis error bars reflect a ∼10% error in force determination. Y-axis error bars are the standard deviation.