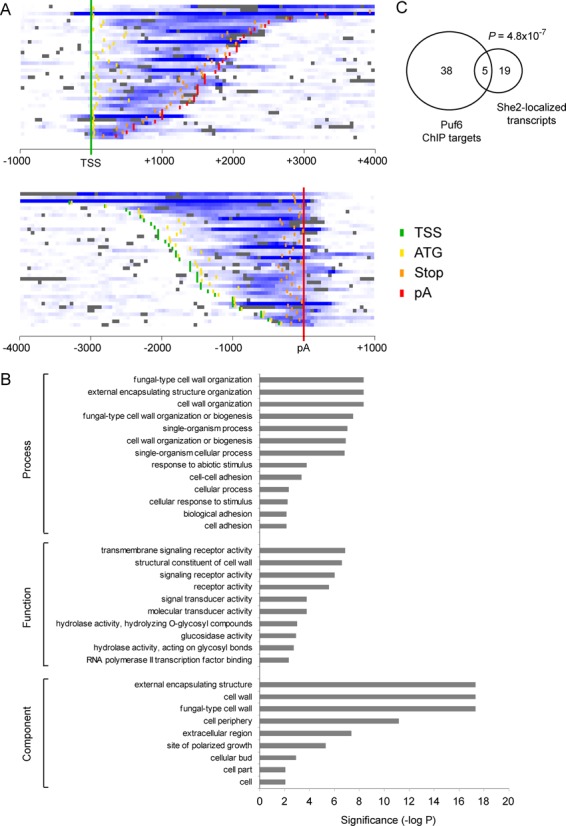
Figure 5.

Genome-wide identification of Puf6 targets. (A) Heat map of Puf6 occupancy (shades of blue) along its target genes. Genes were either aligned on their TSSs (top panel) or on their pA (bottom panel). The positions for the TSS (green), ATG (yellow), stop codon (orange) and pA (red) are shown. (B) Gene ontologycategories that are significantly enriched among the 43 Puf6 targetgenes identified in this study. Categories with an enrichment (P-value) of 0.01 or less are shown. (C) A Venn diagram showing the overlap between the 43 Puf6 target genes identified in this study and the 24 She2-localized transcripts identified by (3).
