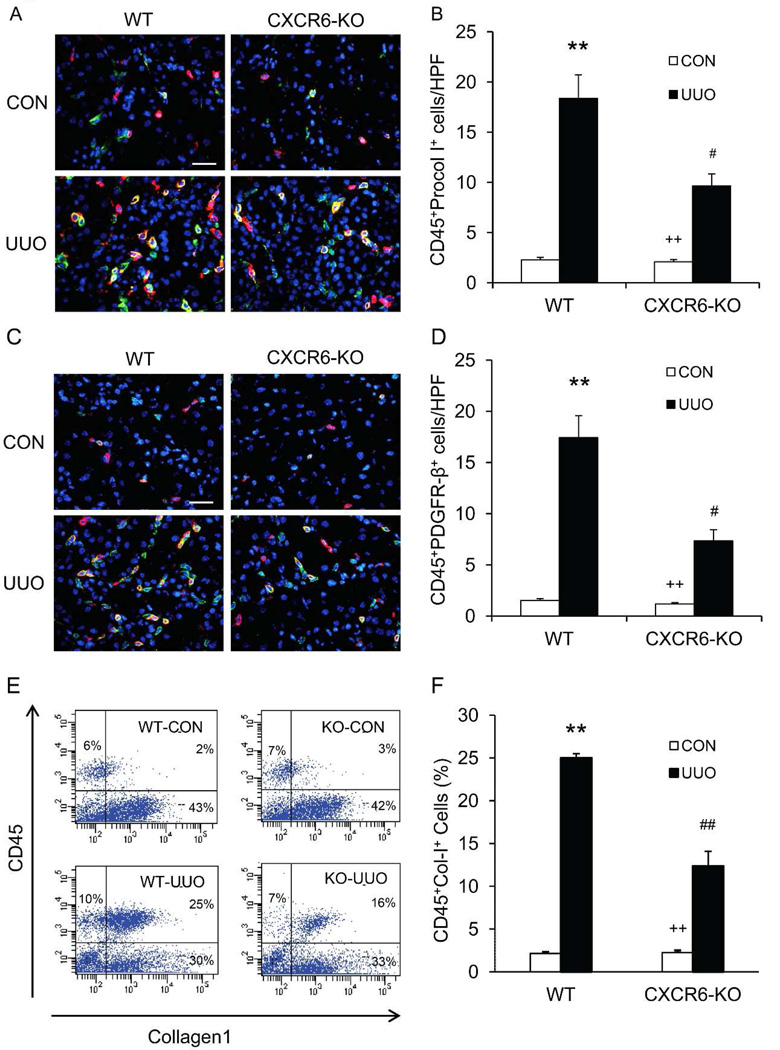
Figure 2. CXCR6 deficiency suppresses the accumulation of bone marrow-derived fibroblasts in the kidney in response to obstructive injury.
A. Representative photomicrographs of kidney sections from WT and CXCR6-KO mice 7 days after UUO stained for CD45 (red), procollagen I (green), and DAPI (blue). Scale bar: 25 µm. B. Quantitative analysis of CD45+ and procollagen I+ cells in kidneys of WT and CXCR6-KO mice 7 days after UUO. ** P < 0.01 versus WT controls, + P < 0.05 versus KO UUO, and # P < 0.05 versus WT UUO. n=6 per group. C. Representative photomicrographs of kidney sections from WT and CXCR6-KO mice 7 days after UUO stained for CD45 (red), PDGFR-β (green), and DAPI (blue). Scale bar: 25 µm. D. Quantitative analysis of CD45+ and PDGFR-β+ cells in kidneys of WT and CXCR6-KO mice 7 days after UUO. ** P < 0.01 versus WT controls, + P < 0.05 versus KO UUO, and # P < 0.05 versus WT UUO. n=6 per group. E. Representative cytometric diagrams showing the effect of CXCR6 deficiency on the accumulation of CD45+ and collagen I+ cells in the kidneys. F. Quantitative analysis of CD45+ and collagen I+ cells in the kidneys. ** P < 0.01 versus WT controls, ++ P < 0.01 versus KO UUO, and ## P < 0.01 versus WT UUO. n=3 per group.

