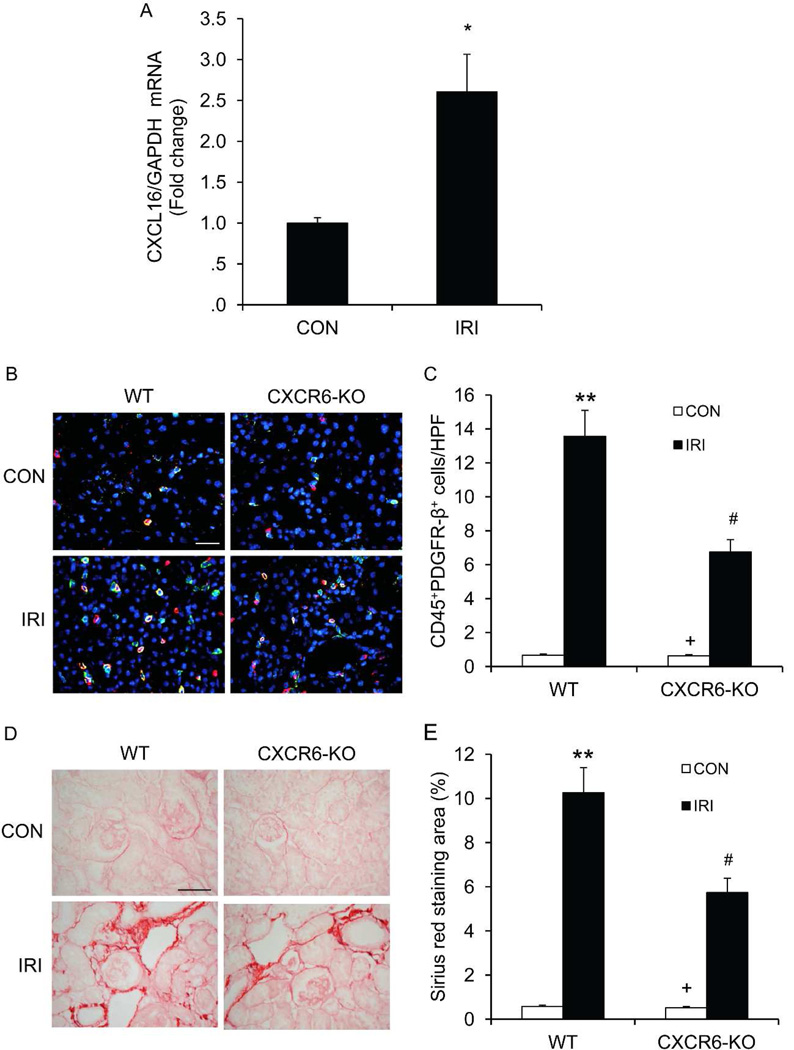
Figure 8. CXCR6 deficiency suppresses bone marrow-derived fibroblast accumulation and collagen deposition in the kidneys in response to IRI.
A. CXCL16 is induced in the kidney after IRI. * indicate p<0.05 versus sham controls. n=5. B. Representative photomicrographs of kidney sections from WT and CXCR6-KO mice 7 days after IRI stained for CD45 (red), PDGFR-β (green), and DAPI (blue). Scale bar: 25 µm. C. Quantitative analysis of CD45+ and PDGFR-β+ cells in the kidneys 7 days after IRI. ** P < 0.01 versus WT controls, + P < 0.05 versus KO IRI, and # P < 0.05 versus WT IRI. n=6 per group. D. Representative photomicrographs of kidney sections from WT and CXCR6-KO mice 2 weeks after IRI stained with Sirius red. Scale bar: 50 µm. E. Quantitative analysis of interstitial collagen content in the kidneys. ** P < 0.01 versus WT controls, + P < 0.05 versus KO IRI, and # P < 0.05 versus WT IRI. n= 6 per group.

