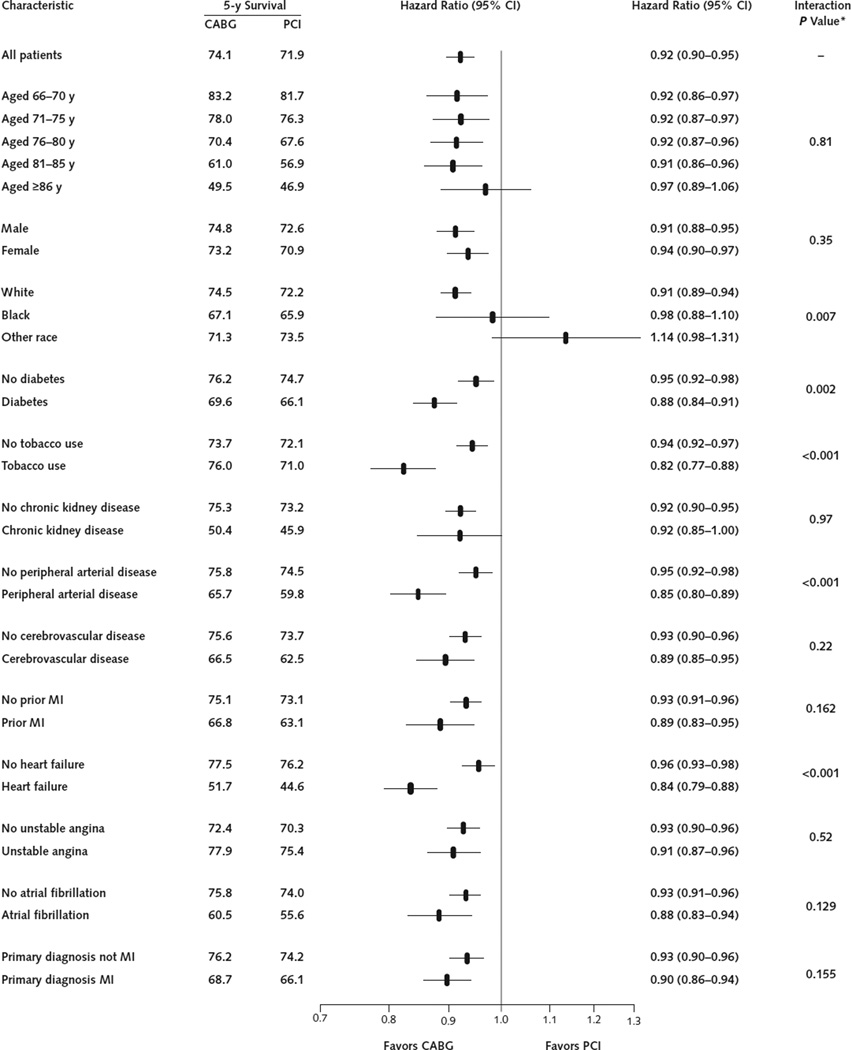
Figure 2. Five-year Kaplan–Meier survival estimates and CABG–PCI hazard ratios and associated 95% CIs in subgroups of the propensity score–matched cohort.
CABG = coronary artery bypass graft; MI = myocardial infarction; PCI = percutaneous coronary intervention.
* P values for the interaction with treatment are from models that adjusted only for CABG treatment, the covariate, and their interaction but not for additional baseline covariates.

