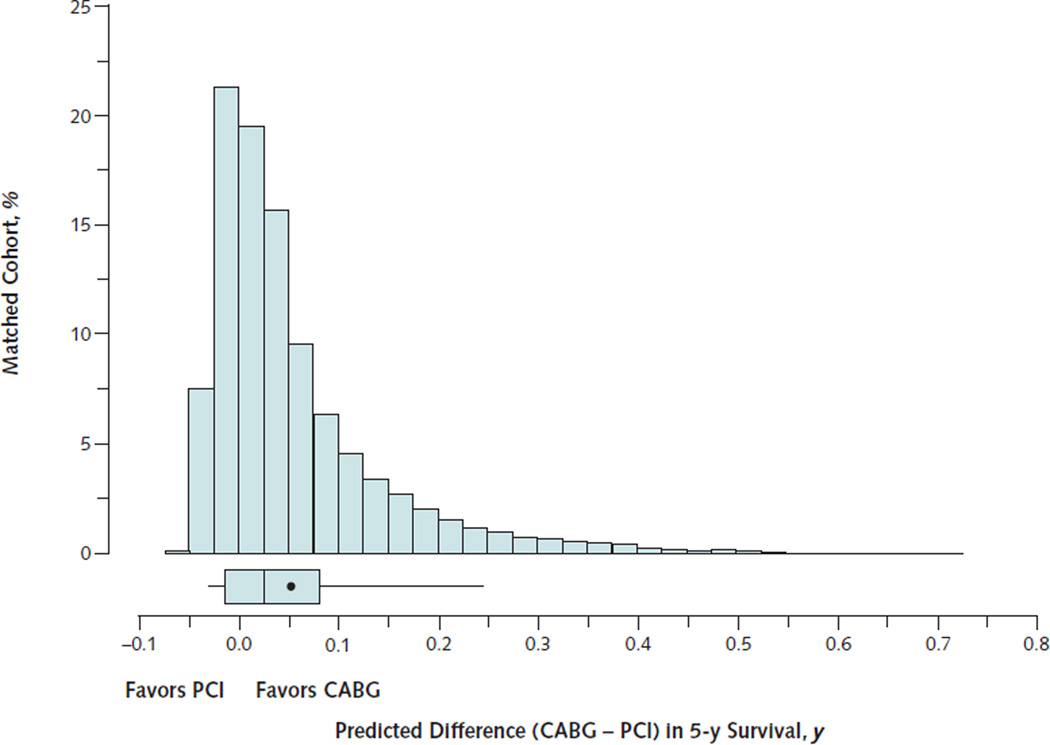
Figure 3. Distribution of the estimated life-years of survival added by CABG compared with PCI over 5-y follow-up.
The percentage of the study population is indicated on the vertical axis, and the life-years of survival added over 5-y follow-up are shown on the horizontal axis. The box-and-whisker plot indicates the 50th percentile as the line within the box; the 25th and 75th percentiles as the left and right edges of the box, respectively; and the 5th and 95th percentiles as the left and right whiskers, respectively. The mean is indicated by the point within the box.
CABG = coronary artery bypass graft; PCI = percutaneous coronary intervention.

