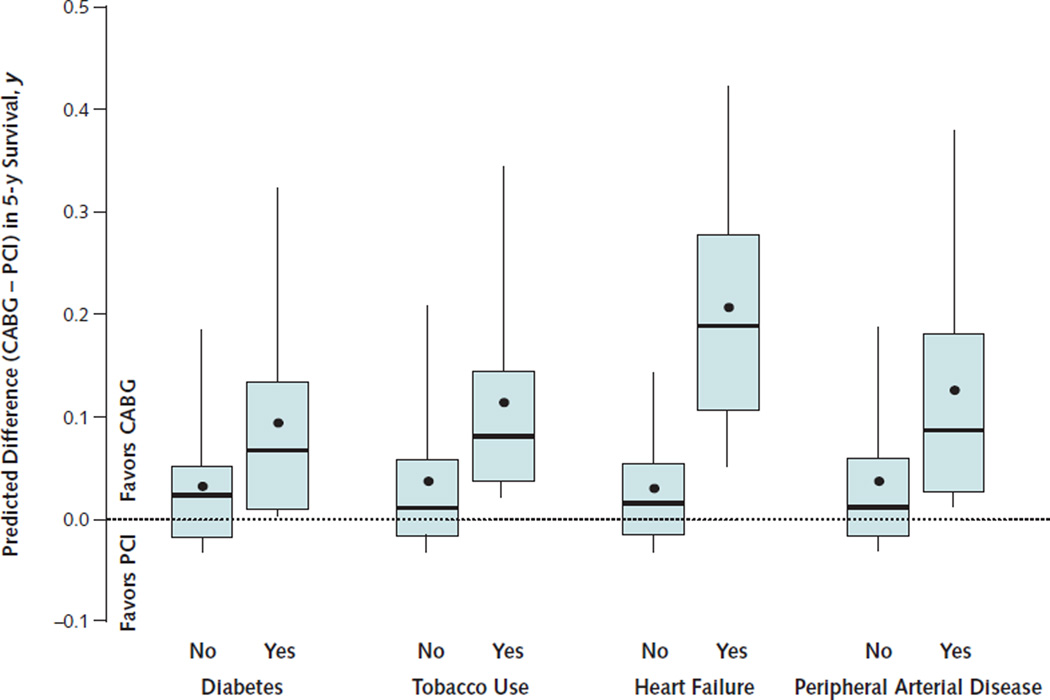
Figure 4. Distribution of the estimated life-years of survival added by CABG compared with PCI over 5 y in clinical subgroups.
The box-and-whisker plots indicate the 50th percentile as the line within the box; the 25th and 75th percentiles as the bottom and top edges of the box, respectively; and the 5th and 95th percentiles as the bottom and top whiskers, respectively. The mean is indicated by the point within the box.
CABG = coronary artery bypass graft; PCI = percutaneous coronary intervention.

