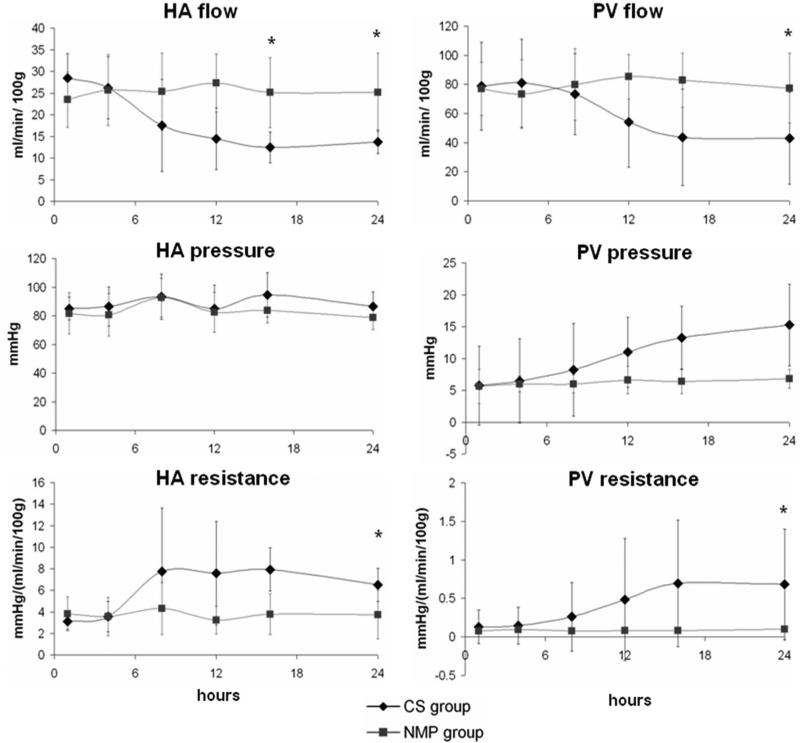
Figure 4. Hemodynamic outcomes during reperfusion.
HA flow indexed by liver weight (per 100 gr liver tissue) was comparable between groups in the early stage of reperfusion, started to decrease in the CS group after 8 hours, and differed significantly (* P<.05) between groups after 16 hours; PV flow had a similar HA flow pattern. HA pressure of the two groups was consistent; PV pressure increased in the CS group after 8 hours reperfusion. CS group had higher HA and PV resistance compared to NMP group after the early stage of reperfusion.

