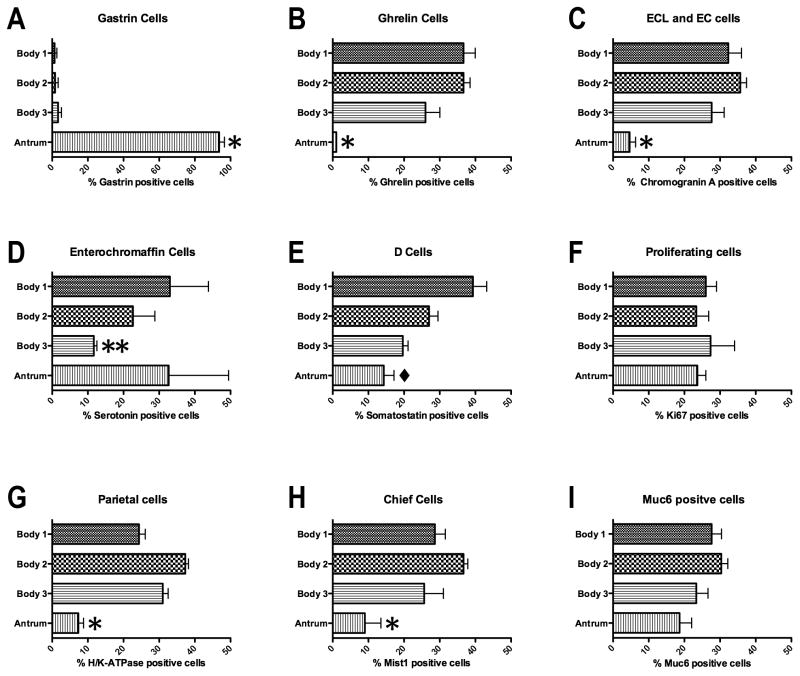
Figure 4. Quantitation of the distribution of cell lineages in the human stomach.
To quantitate the distribution of cell lineages within the human stomachs the specimens were divided into three body regions (proximal to distal): Body 1 (B1), Body 2 (B2) and Body 3 (B3) and the antrum. The numbers of cells staining for each lineage in each zone were determined as a percentage of the total labeled cells in each stomach specimen. The percentages of labeled cells in each region were compared with ANOVA and Bonferroni’s test for significant means. *p<0.05 between the antrum and all three Body regions; **p<0.05 comparing antrum to B1 and B2; ◆p<0.05 comparing B3 with both B1 and antrum. All bars represent the mean ± SEM.

