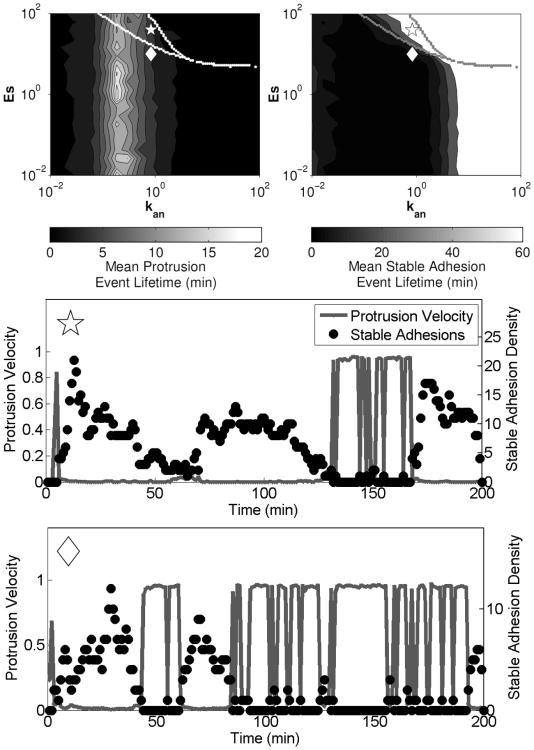
Figure 7. Regions of bistability overlaid on stochastic simulation results.
Mean lifetimes of protrusion and adhesion events were calculated as described in the caption for Figure 5, and regions of bistability were identified by finding the steady state(s) of the deterministic model equations numerically using different combinations of initial conditions (upper panels). Stochastic simulation results corresponding to the parameter values indicated by the symbols in the upper panels are shown in the lower panels. Results are adapted from (Welf and Haugh, 2010) with In = 10, Is = 1, and Cs = 100.

