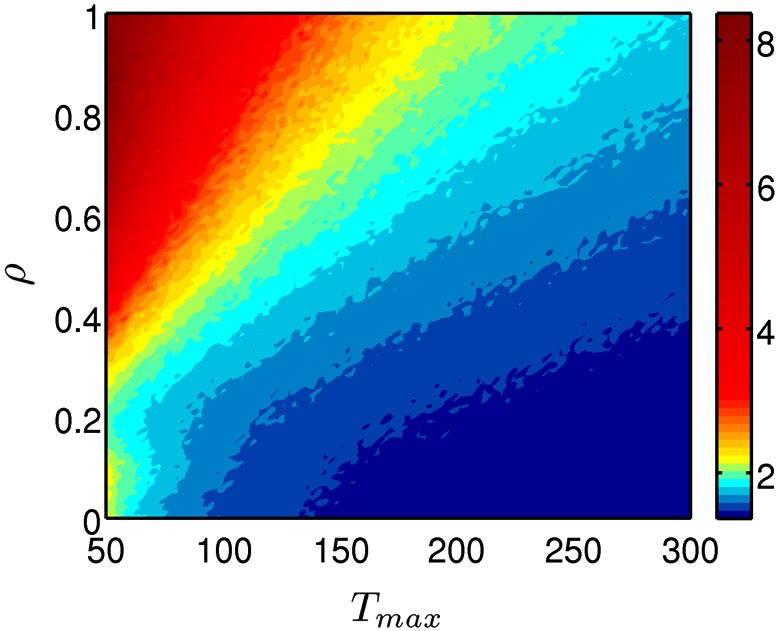
Figure 3.

Persistence of the choice behavior predicted by the mathematical model. The model was computed for different values of for different values of ρ (importance given to gains or losses) and Tmax parameters (degree of decision randomness) and the resulted persistence level was plotted by using a color code, with red indicating high probability and blue high probability of keep selecting from the same deck.
