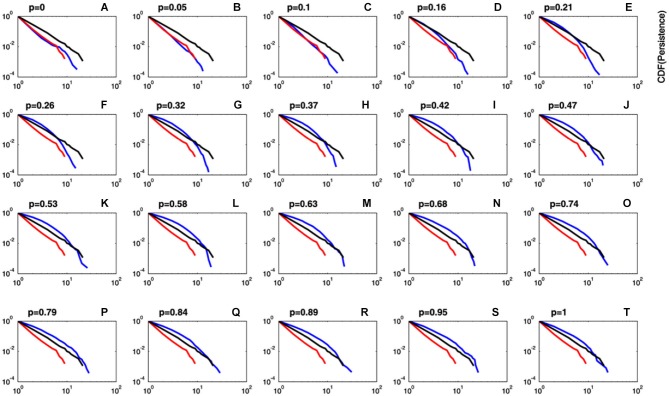
Figure 4.
Comparison between predicted and observed cumulative distribution functions of persistence. Plots of the CDF of the predicted persistence (blue lines) at different values of ρ (importance given to gains or losses) and a fixed value of Tmax = 50 (degree of decision randomness). For comparison purposes, CDFs for observed data in chronic pain patients (red lines) and HCs (black lines) are also displayed. It can be observed that CDF for predicted persistence by the model at ρ values close to zero (blue lines in plots A–C) perfectly fits data in chronic pain patients (red line). Plots of the CDF computed by the model were close to data in HCs (black lines) for ρ values greater than 0.15 (plots D–T).

