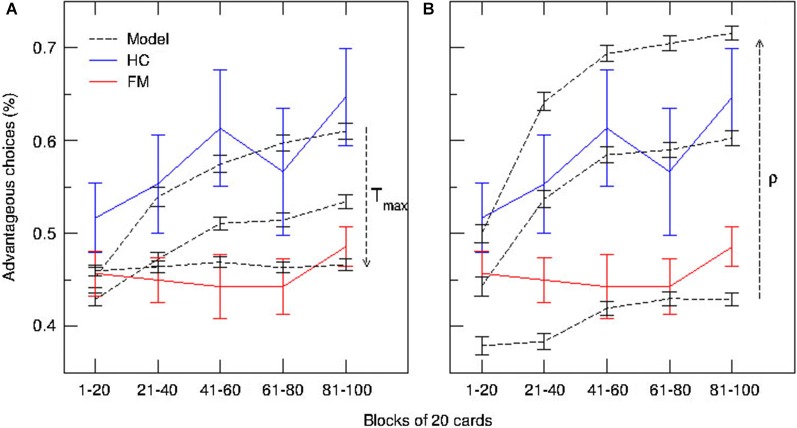
Figure 5.
Predictions of the model and behavioral performance of patients with chronic pain and healthy controls on the IGT over time. Blue and red lines represent the median used to compute proportions of advantageous and disadvantageous choices for each block of 20 trials in patients with chronic pain (FM) and HCs, respectively. (A) Simulated time-course of choices at three different values of Tmax (degree of decision randomness) (dashed lines). (B) Simulated time-course of choices at three different values of ρ (importance given to gains or losses) (dashed lines).

