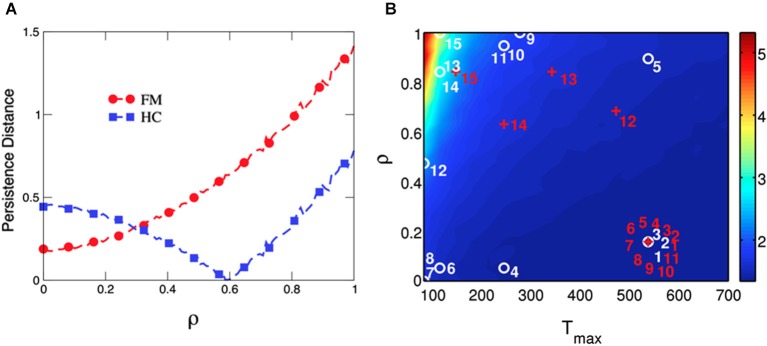
Figure 6.

Goodness-of-fit of the model computed as the distance between predicted and observed behavioral persistence for chronic pain patients and healthy controls at the group- and the individual-level. Data modeling of chronic pain patients (FM) show that the distance between predicted and observed data is minimized at ρ = 0, whereas the distance is minimal at ρ = 0.6 for HCs (Panel A). The parameter Tmax (degree of decision randomness) was held constant at 50, as in Figure 4. The model is able to separate both groups by fitting the persistence of each single subject in the space of the free parameters in our model (ρ and Tmax) (Panel B). The labels for chronic pain patients (numbered red crosses) and HCs (numbered white circles) are placed where the difference between predicted and observed persistence is minimized. The persistent behavior of most chronic pain patients (numbered from 1 to 11 in red) is best reproduced by the model when Tmax is high (ramdom decision) and ρ is low (more importance is given to gains than to losses). On the other hand, performance of most HCs is best reproduced with lower Tmax (decision guided by the last experience) and higher values of ρ (more importance is given to losses than to gains).
