Figure 4.

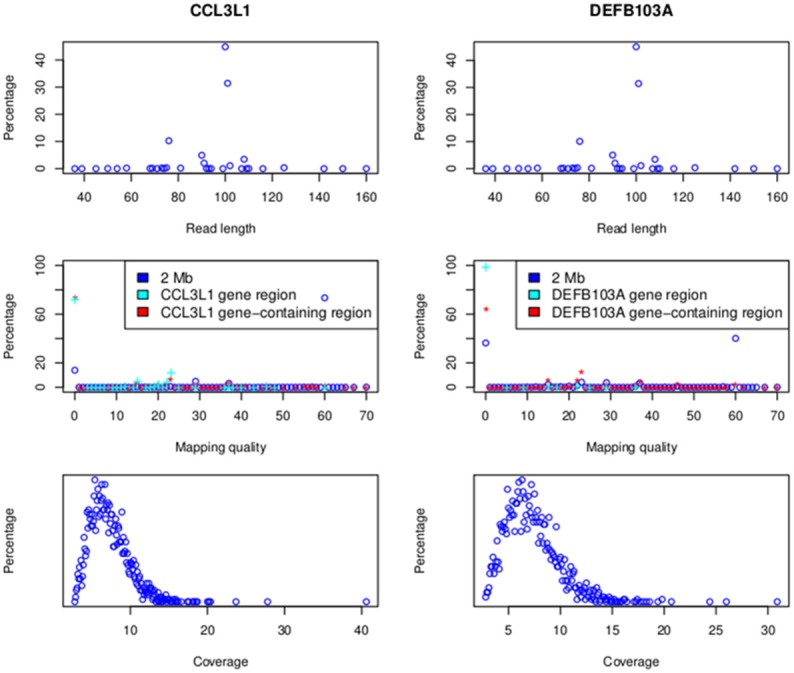
Read lengths and mapping qualities (top), mapping qualities (middle) and average read depth (bottom). Data for the 2 MB CCL3L1 region are on the left and the 2 Mb DEFB103A region on the right.

Read lengths and mapping qualities (top), mapping qualities (middle) and average read depth (bottom). Data for the 2 MB CCL3L1 region are on the left and the 2 Mb DEFB103A region on the right.