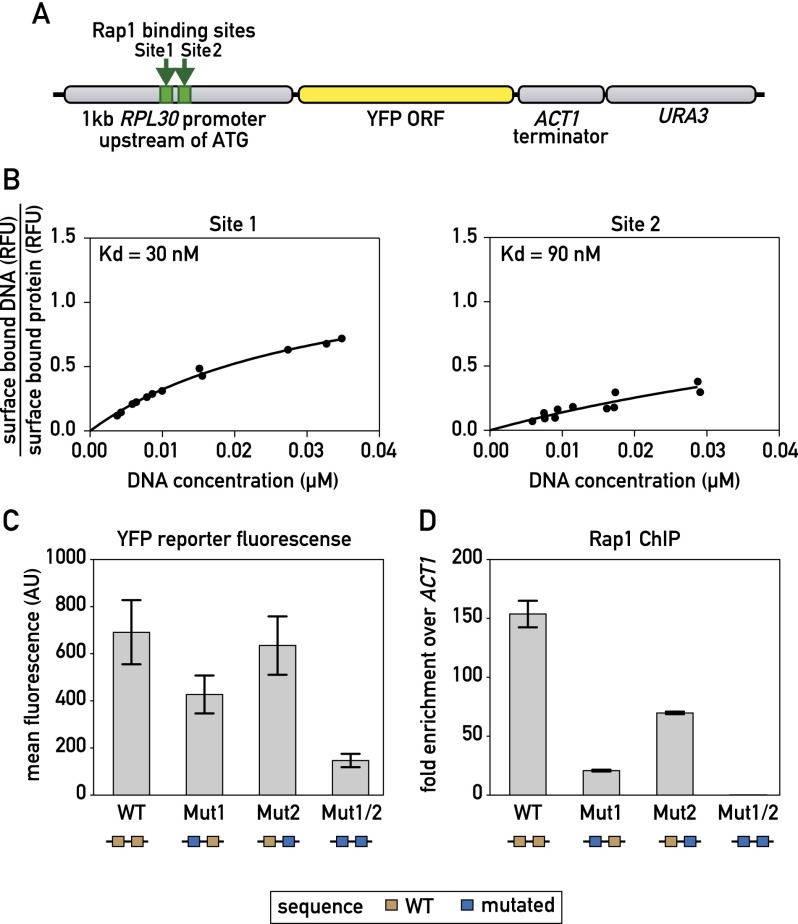
Figure 2.
Correlation between Rap1-binding constant and promoter output. (A) Schematic showing the RPL30 promoter-YFP reporter construct that was integrated at the LEU2 locus. (B) MITOMI measurements of the fraction of surface-bound target DNA are plotted against the concentration of target DNA in solution for the indicated binding site probes. Dissociation constants (Kd) were determined by performing a nonlinear regression fit using a one-site binding model. (C) YFP fluorescence measured by flow cytometry of exponentially growing cells containing the indicated RPL30 promoter-YFP reporter constructs. Data are represented as mean ± SEM. (D) Rap1 occupancy (qPCR-ChIP) on the indicated RPL30 promoter-YFP reporter constructs. Data are represented as mean ± SEM. See also Supplemental Figure S5.

