Figure 6.
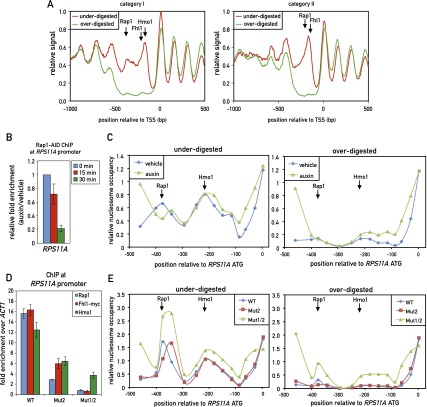
TF binding at both category I and category II promoters overlaps with unusually MNase-labile chromatin. (A) Chromatin was underdigested or overdigested with MNase and sequenced (see the Materials and Methods). The average relative signal (a proxy for nucleosome occupancy) for category I (left) and category II (right) promoters aligned to their TSSs is plotted. Arrows mark the average positions of peak binding of Rap1, Fhl1, and Hmo1, as measured by ChIP-seq. (B) RPS11A promoter occupancy of Rap1 after auxin-induced depletion of AID-tagged Rap1. Data are plotted as auxin relative to vehicle treatment and normalized to t = 0. Data are represented as mean ± SEM. (C) Chromatin was underdigested (left panel) or overdigested (right panel) with MNase either before or 30 min after auxin-induced depletion of AID-tagged Rap1. Tiling qPCR reactions were used to measure DNA protection. (D) RPS11A promoter occupancy of Rap1, Fhl1-myc, and Hmo1 on the wild-type RPS11A promoter and promoters with one (Mut2) or two (Mut1/2) Rap1 sites mutated. The RPS11A promoter contains two forward Rap1-binding sites located at −404 bp and −384 bp upstream of the ATG. Mut2 corresponds to mutation of the −384-bp site, and Mut1/2 corresponds to mutation of both sites. Data are represented as mean ± SEM. (E) Chromatin from the indicated strains (RPS11A wild-type or mutant promoters, as described in C was underdigested (left panel) or overdigested (right panel) with MNase. DNA was measured as in C. See also Supplemental Figures S8 and S9.

