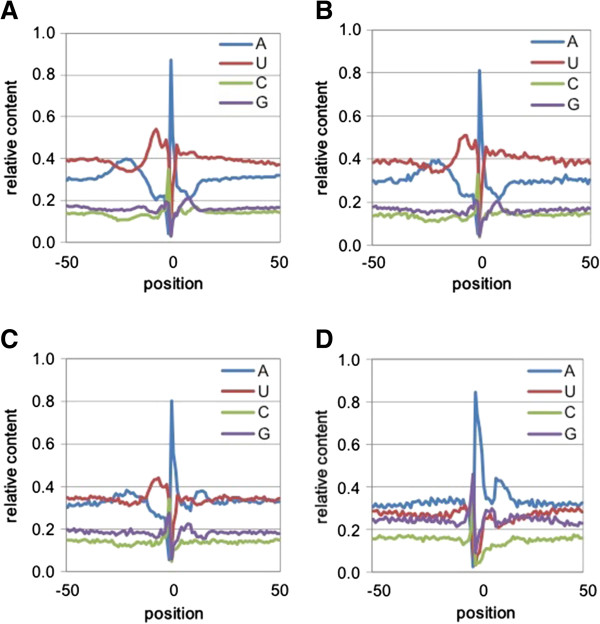
Figure 2.

Nucleotide compositions of the sequences surrounding M. truncatula PACs with different genomic regions. Position-by-position base composition of PACs that map to 3′-UTRs (A), introns (B), intergenic regions (C), protein coding regions (D). Y-axis values are the fractional nucleotide content at each position (plotted along the x-axis); individual traces are color coded as indicated. On the x-axis, “0” denotes the actual cleavage/polyadenylation site.
