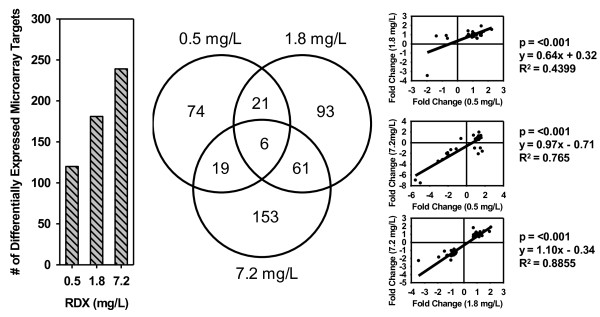
Figure 3.

Effect of RDX on transcript expression in Acropora formosa . The bar chart and Venn diagram represent the total number of transcripts observed to have undergone significant differential expression compared to controls. The Venn diagram displays the number of differentially expressed transcripts that were common among the RDX treatments. Regression plots show log2 fold-change relationships among differentially expressed transcripts found in common among RDX treatments.
