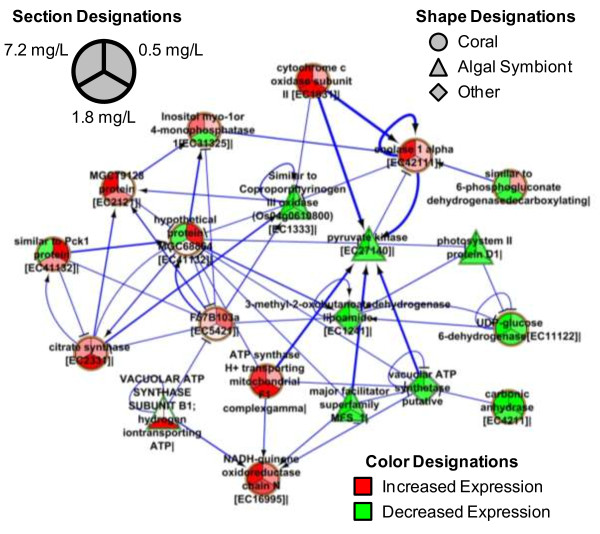
Figure 6.

Transcriptional network inference of coral holobiont interactions. The network analysis demonstrates correlations of expression among molecular targets and species comprising the coral holobiont in response to RDX exposure. The network includes all Kyoto Encyclopedia of Genes and Genomes terms involved in carbohydrate and energy metabolism. Edge thickness represents correlation strength among nodes. Arrows represent “activation” from one node to the next while “T” ends represent “inhibition”. At least one RDX exposure concentration elicited significant differential transcript expression for each gene, however we have provided expression information for all treatment levels to show trends.
