
Figure 2.
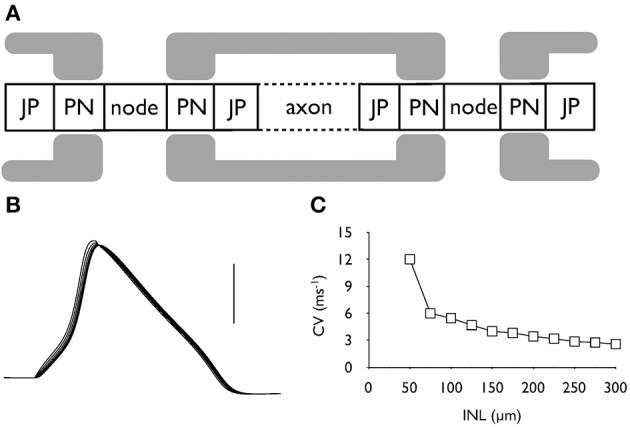
Action potential conduction along the central portion of the auditory nerve. (A) Schematic model of the axonal compartments in the control auditory nerve model. (B) Evoked action potentials recorded at six successive nodes illustrating action potential conduction along an axon. Scale bar is 50 mV and the duration of the recording is 2 ms. (C) The conduction velocity decreases as internodal length (INL) is increased from the control value of 100 μm.