
Figure 3.
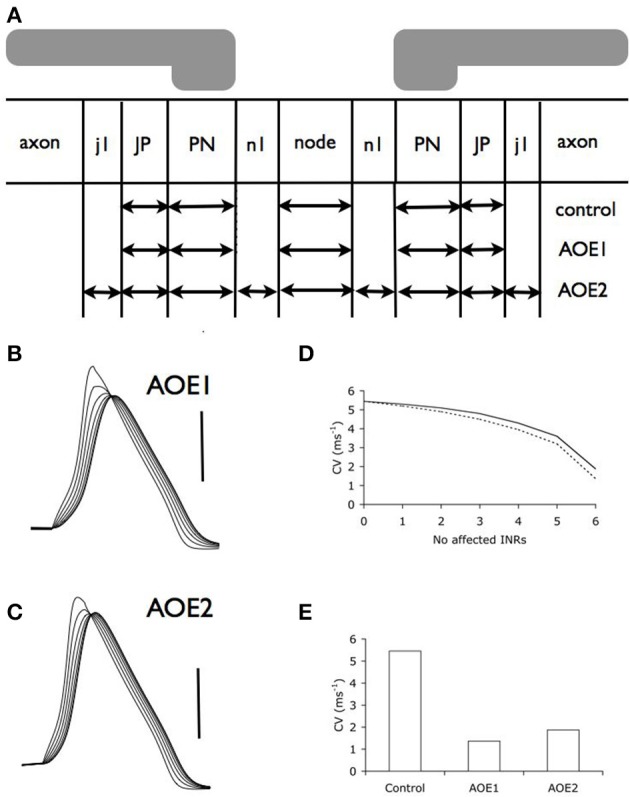
Auditory overexposure decreases conduction velocity. (A) Schematic model of the central portion of the auditory nerve after AOE, illustrating the morphological changes incurred by the nerve. See Table 2 for dimensions of compartments. (B,C). Action potentials evoked from six successive nodes after AOE1 (B) or AOE2 (C) treatment demonstrated a decrease in the conduction velocity. Scale bars 50 mV in B and C and duration of recording is same as Figure 2B. (D) Incremental decrease in conduction velocity as more INRs are affected by AOE-induced dysmyelination in AOE1 (dotted line) and AOE2 (line) models. (E) Conduction velocity (with an INL of 100 μm) decreases as a result of both AOE1 and AOE2 (see Methods for details).