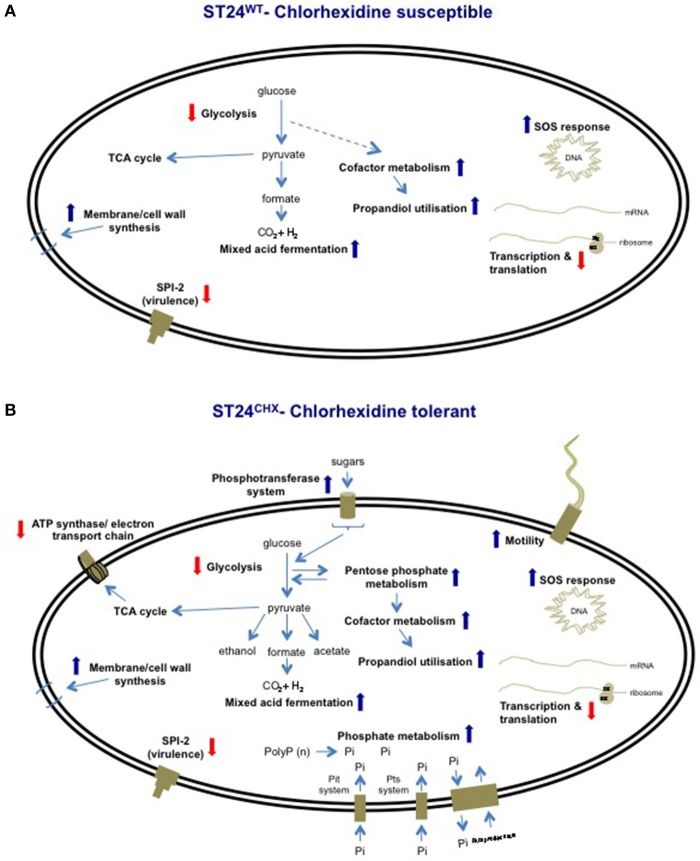
Figure 11.
Overview of cellular process altered by chlorhexidine, relative to the chlorhexidine-sensitive ST24WT, in (A) the same isolate following chlorhexidine exposure and (B) in the chlorhexidine tolerant ST24CHX, with and without chlorhexidine exposure. Red arrowheads shown signify reduced expression and blue arrowheads signify increased expression.

