
Table 3.
Effects on N-acyl amide lipidomics profile in 6 brain areas 1 and 3 h post carrageenan.
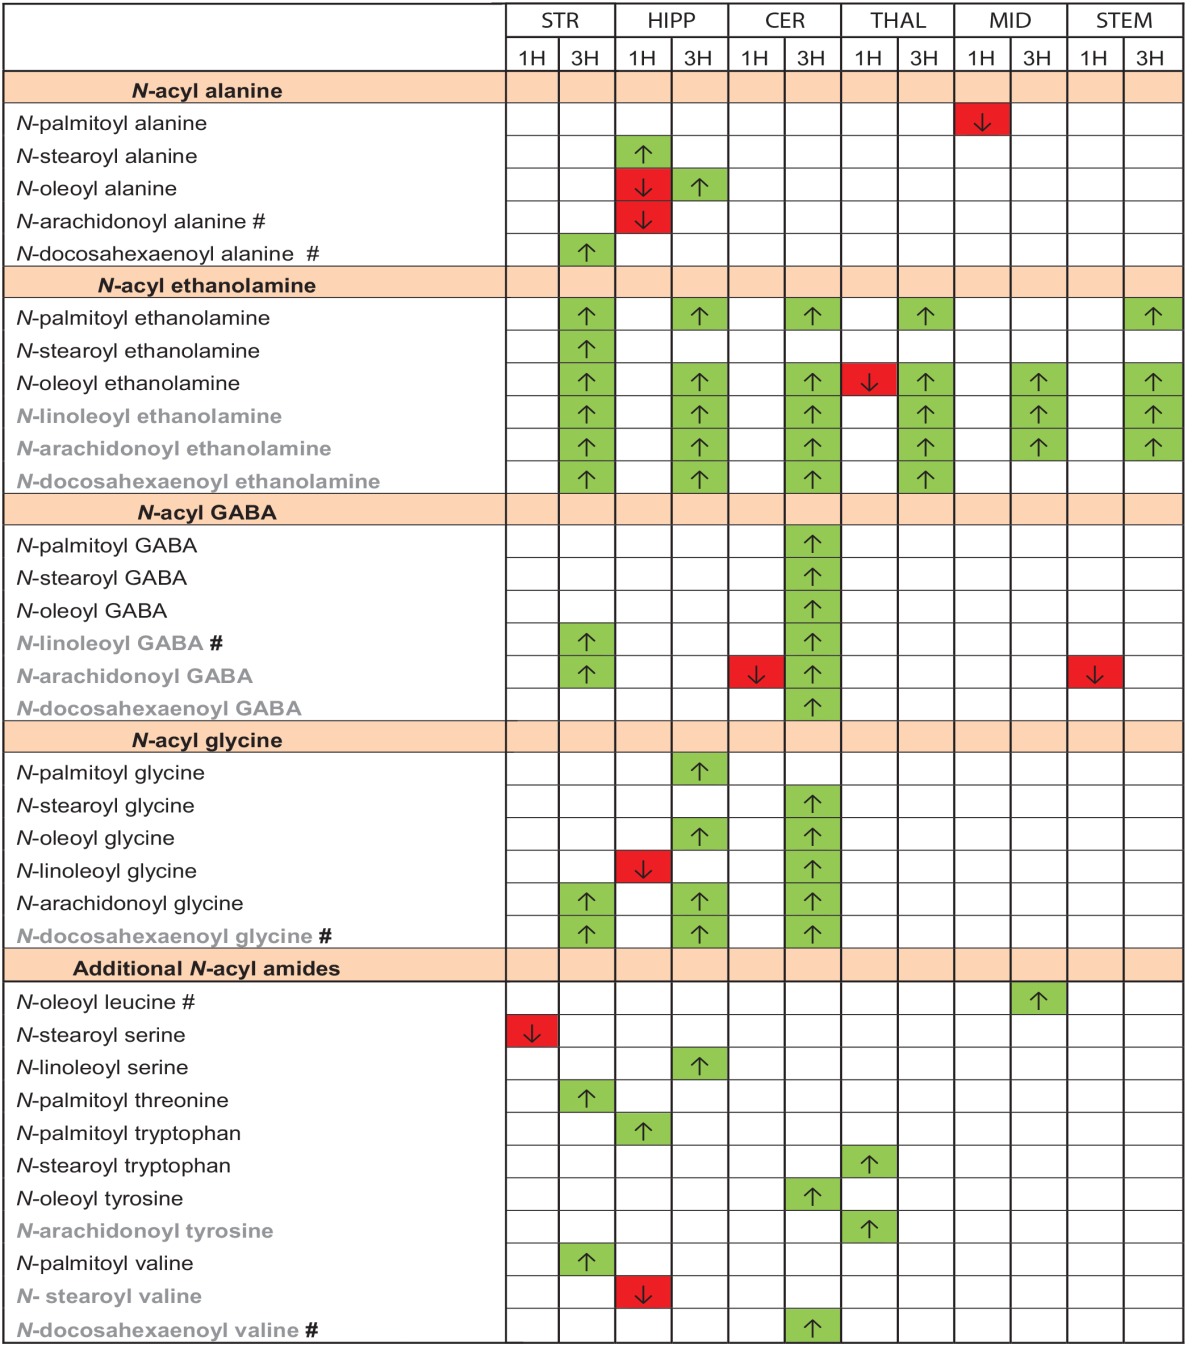
These are the summary data of those N-acyl amides that were significantly modified (increased or decreased) from the levels measured in the vehicle control and do not represent all lipids tested. All averaged values for all lipids tested are shown in Supplemental Table 2. Six brain areas (STR, striatum; HIPP, hippocampus; CER, cerebellum; THAL, thalamus; MID, midbrain; STEM, brainstem) are depicted in individual columns further separated by the treatment groups 1 hour (1H) and 3 hour (3H) post carrageenan. Those in green with an up arrow showed significant increases from control injections, whereas, those in red with down arrows showed significant decreases from control injections p = 0.05. Those in gray are N-acyl amides that activated on of the TRPV systems tested here. #Denotes that these compounds had not been previously identified in mammalian brain.