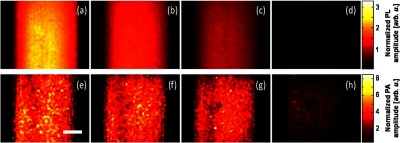
Fig. 5.

Comparison of sections from TP-PL (top row) and TP-PA (bottom row) of a Rhodamine B filled capillary tube submerged in optically scattering medium. Panels (a) to (d) are TP-PL images at intralipid concentration of 0%, 0.25%, 0.4%, and 1%, respectively. Panels (e) to (h) are the TP-PA images acquired at corresponding intralipid concentrations for panels (a)–(d). The images are interpolated five times and are plotted in a linear scale as indicated by the color bars. Scale bar: 100 μm.
