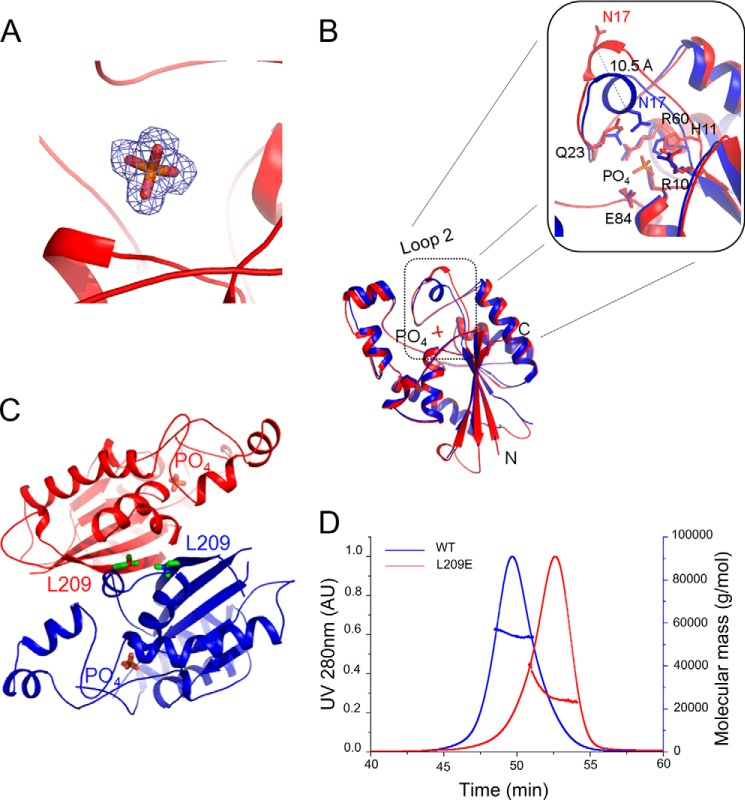
FIGURE 4.
Conformational changes of MtbGpgP during product release. A, 2Fo − Fc electron density for the orthophosphate contoured at 1σ. B, superimposition of the vanadate bound structure of MtbGpgP (blue) over the structure of the phosphate-bound MtbGpgP (red) reveals conformational changes in loop 2 of the enzyme. Notably, Asn17 has moved >10 Å away from the active site (inset). C, location of Leu209 with respect to the dimer interface and the active site. Leu209 and phosphate are shown as sticks. D, on-site MALS during size exclusion chromatography of WT and L209E mutant of MtbGpgP. Comparison of the elution time with those of standards revealed that WT enzyme elutes as a dimer (blue curve), whereas the mutant elutes as a monomer (red curve).

