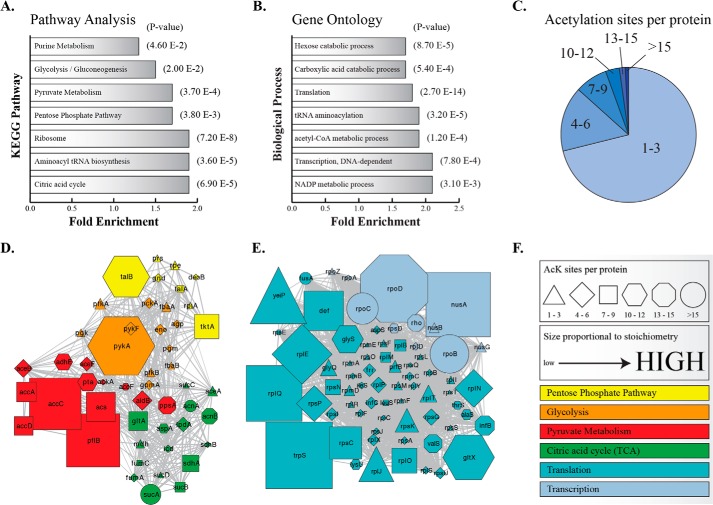
FIGURE 7.
Bioinformatic and network analysis of acetylation stoichiometry. KEGG pathway analysis (A) and gene ontology (B) of biological process for acetylated proteins in both WT and ΔCobB using an acetylation stoichiometry greater than 7% (average stoichiometry). Pathways and biological processes are significantly enriched (p < 0.05) above an unmodified, trypsin-digested E. coli proteome (background proteome used for DAVID analysis). C, pie chart of acetylation sites detected per protein. Network analysis of metabolic pathways (D) and transcriptional and translational biological processes (E). F, legend for D and E. Shapes represent the number of acetylation sites detected per protein. The size of the shape is proportional to the highest acetyl peptide stoichiometry of a protein in either WT or ΔCobB. Proteins are colored according to pathway or biological process.

