FIGURE 2.
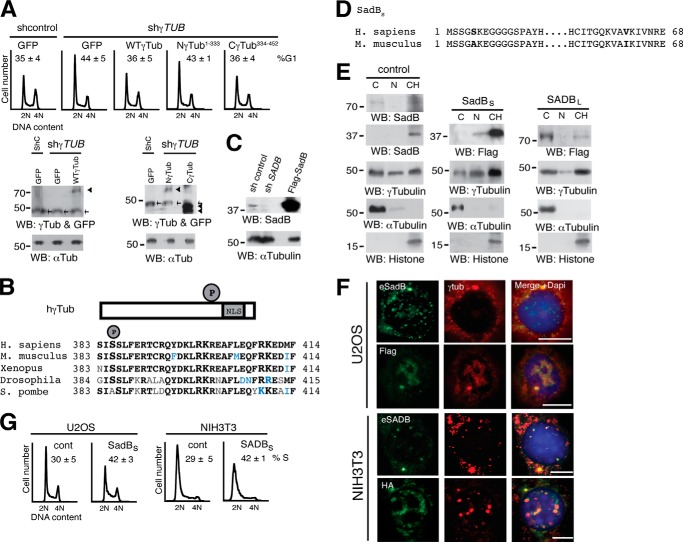
An increased level of SadBS augments the nuclear pool of γ-tubulin. A, the DNA content was determined by flow cytometry of non-synchronous U2OS cells expressing shRNA (shcontrol; shC) or sh-γ-TUBULIN (shγTUB) and co-transfected with one or the following constructs: GFP, wild-type γ-tubGFP (WT-γ-Tub), Nγ-tubGFP (Nγ-Tub1–333), or Cγ-tubGFP (Cγ-Tub334–452), as indicated. The data on each cell population are presented as the proportion of cells in G1 (n = 3). Bottom, cell extracts were analyzed by Western blotting. Arrowheads and arrows show GFP and endogenous γ-tubulin, respectively (n = 3). B, structure of wild-type human γ-tubulin (hγTub) constructs depicting the NLS and phosphorylated Ser385 (P). The region surrounding Ser385 is conserved in the indicated species. Boldface letters, identity; blue letters, polar or hydrophobic conservation. C, total lysate of U2OS cells transfected with a control vector, SADB shRNA, or FLAG-SadBS and analyzed by Western blotting (WB) using an anti-SadB antibody, followed by anti-α-tubulin (n = 3). D, structure of human SadBS (top) and mouse SADBS (bottom) constructs showing the amino acids that differ between the two isoforms in boldface type. E, U2OS cells (1 × 10⁶) expressing control, FLAG-tagged human SadBS, or mouse SADBL vectors were biochemically divided into cytosolic (C), nuclear membrane (N), and chromatin (CH) fractions, as in Fig. 1C, and analyzed by Western blotting (WB; n = 5). F, localization of endogenous human and mouse SadB (eSadB and eSADB, respectively), FLAG-SadBS, HA-SADBS, and endogenous γ-tubulin was examined by immunofluorescence staining with SADBS, FLAG, or HA (green) and γ-tubulin (red). Nuclei were detected using DAPI (blue) in transfected human U2OS and mouse NIH3T3 cells (n = 5). Fluorescence intensity of endogenous nuclear γ-tubulin staining in cells expressing FLAG-SadBS or HA-SADBS was quantified relative to control cells. Scale bars, 10 μm. G, flow cytometry was performed to determine DNA content in control NIH3T3 or U2OS cells transfected with FLAG-SadBS (SadBS) or HA-SADBS (SADBS), as indicated. The percentage of S phase cells is shown in each panel (n = 3).

