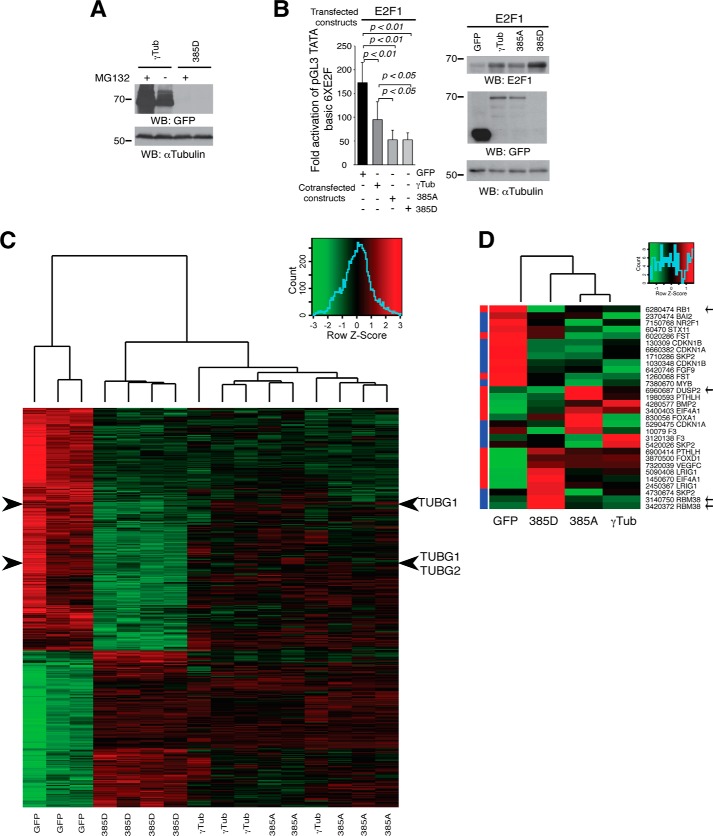
FIGURE 6.
Ser385-γ-tubGFP mutants moderate transcriptional activity during cell cycle. A, U2OS cells expressing γ-tubGFP (γTub) or Asp385-γ-tubGFP (D385γTub) were treated overnight in the presence or absence of 10 μm MG132. The indicated antibodies were used to analyze Western blot (WB) of total cell lysates (n = 2). B, assay of the luciferase activity driven by six E2F promoter binding sites on transient transfection of U2OS cells with a Renilla reporter construct and the following constructs: HA-E2F1, GFP, γ-tubGFP (γTub), Ala385-γ-tubGFP (385A), or Asp385-γ-tubGFP (385D), as indicated, is shown at the left. Luciferase activity of cells transfected with control construct was set as 1, and relative activities were calculated (mean ± S.D.; n = 3). At the right are shown total lysates of transfected U2OS cells that were analyzed by Western blot with the indicated antibodies. C, an mRNA expression array was performed on U2OS cells ectopically expressing GFP (n = 3), Asp385-γ-tubGFP (385D; n = 4), γ-tubGFP (γTub; n = 4), or Ala385-γ-tubGFP (385A; n = 5). Comparison of gene expression profiles at the probe set level between cells ectopically expressing Asp385-γ-tubGFP (385D; n = 4) or GFP show that 413 genes were differentially expressed (p < 1 × 10⁻³). The gene expression of the 413 genes is represented in a heat map, in which red and green indicate high and low expression, respectively, according to the scale shown (top right graph). The arrowheads show the expression of TUBG1 and TUBG2. D, the heat map visualizes the comparative gene expression analyses at the probe set level between U2OS cells ectopically expressing GFP (n = 3), Ala385-γ-tubGFP (385A; n = 5), γ-tubGFP (γTub; n = 4), or Asp385-γ-tubGFP (385D; n = 4) of the 20 most differently expressed E2F-regulated genes upon decreased expression levels of γ-tubulin (8), in which green indicates low expression and red indicates high expression according to the scale shown (top right graph). The left column represents the previously reported expression changes (red, increased; blue, decreased) of the 20 E2F-regulated genes affected by decreased γ-tubulin expression (8). The arrows show RB1, DUSP2, and RBM38.

