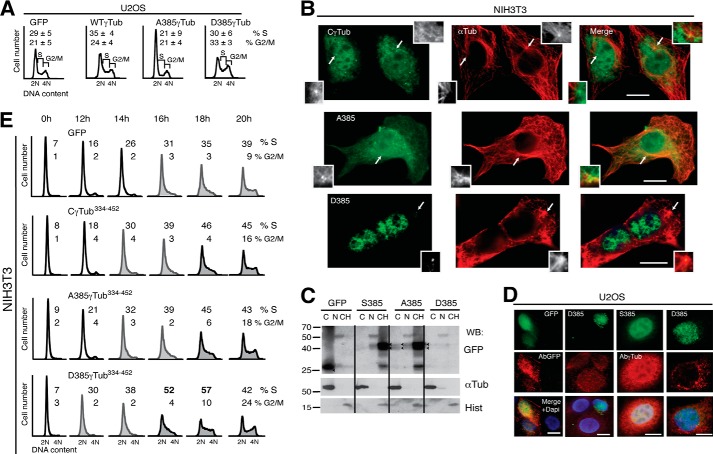
FIGURE 7.
The phosphorylation levels of Ser385 affect cell cycle progression. A and E, flow cytometric analysis of the DNA content in unsynchronized U2OS or synchronized NIH3T3 cells expressing one or two of the following constructs or with the indicated C-terminal mutants: control (GFP), wild-type γ-tubGFP (WT-γTub), Ala385-γ-tubGFP (A385γTub), or Asp385-γ-tubGFP (D385γTub) (A) or Ser385-Cγ-tubGFP (CγTub334–452) (E). A, the data on each cell population are presented as the proportion of cells in S and G2/M phase (n = 3). B and C, localization of the indicated GFP-tagged proteins was detected in transfected NIH3T3 cells by immunofluorescence (green) or Western blotting with the indicated antibodies. B, microtubules were detected with anti-α-tubulin antibody (red; αTub). Arrows, the locations of centrosomes (n = 3). Inset, higher magnification. Scale bars, 10 μm. C, cellular fractions of transfected NIH3T3 cells were analyzed as in Fig. 2E. Arrowheads, GFP (n = 2). D, transiently transfected U2OS cells expressing GFP (green), Cγ-tubGFP (S385; green), or Asp385-Cγ-tubGFP (D385; green) were analyzed by immunofluorescence staining with an anti-GFP (AbGFP; red) or anti-γ-tubulin (Abγ-Tub; red) antibody and nuclei by DAPI staining (blue), as indicated. Scale bars, 10 μm. E, the data on each cell population are presented as the proportion of cells in S phase: <30% (black open histograms), <40% (gray closed histograms), and >40% (black closed histograms; n = 3).

