FIGURE 1.
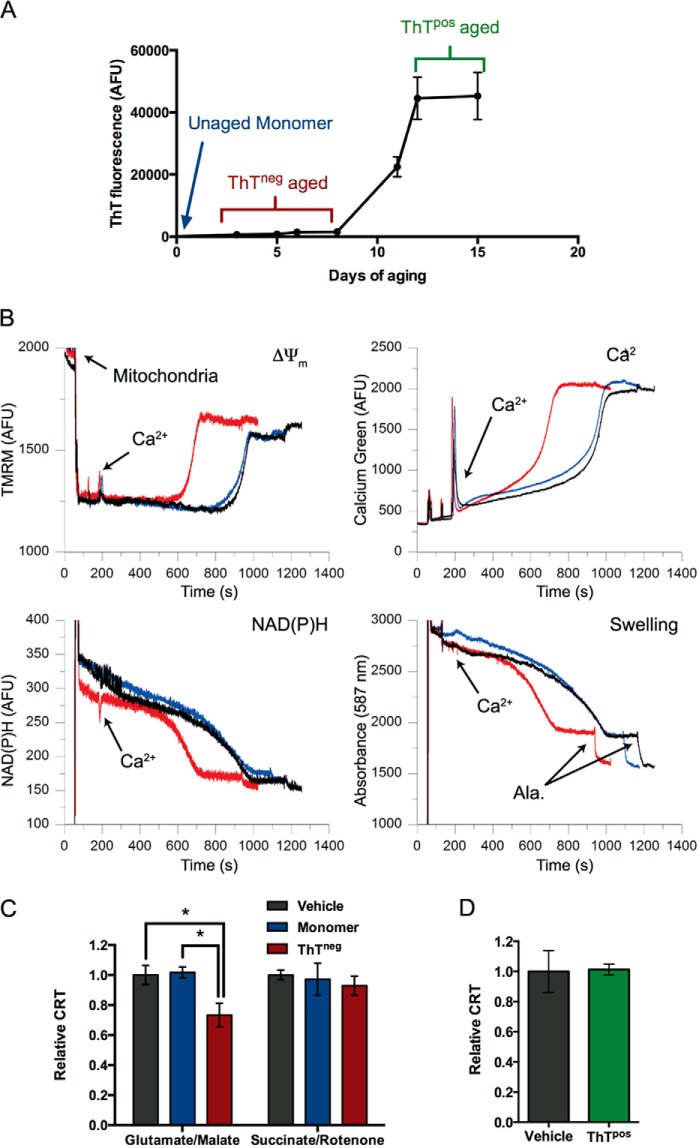
Prefibrillar, ThTneg αSyn sensitizes mitochondria to Ca2+-induced dysfunction in a substrate-dependent manner. A, sample aggregation time course of recombinant αSyn as measured by the fluorescence of the β-sheet-binding dye ThT. 0.6 mg/ml αSyn was aged at 37 °C under nutation, and ThT fluorescence was monitored periodically. αSyn was sampled at three different stages of aggregation for application to mitochondria. Unaged monomeric protein was obtained prior to 37 °C incubation, ThT-negative (ThTneg) aged protein was sampled from the aggregation lag phase, and ThT-positive (ThTpos) aged protein was collected at the end stage of aggregation once ThT fluorescence had plateaued. B, representative traces of basic parameters of isolated liver mitochondria simultaneously measured by a multichannel fluorimeter and recorded in the presence of 5 mm glutamate and 5 mm malate as substrates; either PBS vehicle (black traces), 1 μm monomeric αSyn (blue traces), or 1 μm ThTneg αSyn (red traces); and a single 20 μm Ca2+ addition. Mitochondrial membrane potential (ΔΨm) was measured as changes in TMRM fluorescence. Higher fluorescence intensity corresponds to depolarized mitochondria. Ca2+ concentration in the mitochondrial suspension was measured as Ca-Green 5N fluorescence signal. The redox status of pyridine nucleotides was measured by NAD(P)H autofluorescence. Lower intensity corresponds to a more oxidized state of NAD(P)H. Mitochondrial swelling was measured by the change in light scattering of the mitochondrial suspension. A decrease in scattering indicates a dilution of mitochondrial solutes due to swelling. Spikes result from the additions of Ca2+, αSyn, or vehicle and alamethicin (Ala), which was used at the conclusion of the measurement to induce maximal swelling. C, quantification of the ability of aged, ThTneg but not monomeric αSyn to reduce the mitochondrial retention time of 20 μm Ca2+ under complex I (glutamate and malate as substrates) but not complex II conditions (succinate as a substrate plus rotenone to inhibit complex I). CRT was defined as time from Ca2+ addition to the ultimate plateau of Ca-Green 5N fluorescence. Error bars, S.D. from at least five independent experiments. *, p < 0.05, ANOVA followed by Tukey's multiple-comparison test. D, the relative CRT of ThTpos αSyn taken from the end-stage plateau of fluorescence was compared with vehicle control. Error bars, S.D. of four independent experiments.

