
FIGURE 2.
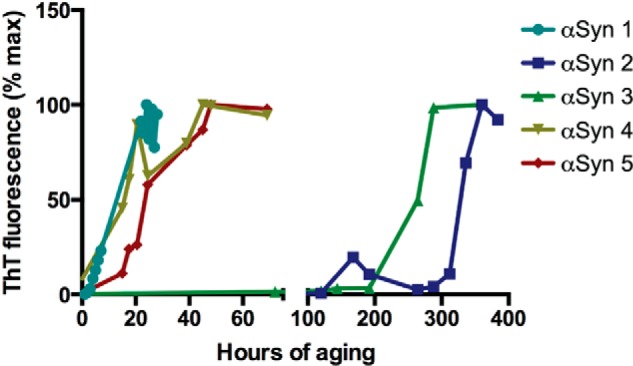
Variation in αSyn aggregation kinetics. Aggregation states of five different 0.6 mg/ml αSyn samples incubated on different days under nutation at 37 °C were monitored over time by ThT fluorescence. Note the broken abscissa and variation in duration of the aggregation lag phase prior to ThT positivity. Raw fluorescence values were normalized to the maximal fluorescence signal for each sample. Error bars were omitted to highlight differences among rather than within samples.