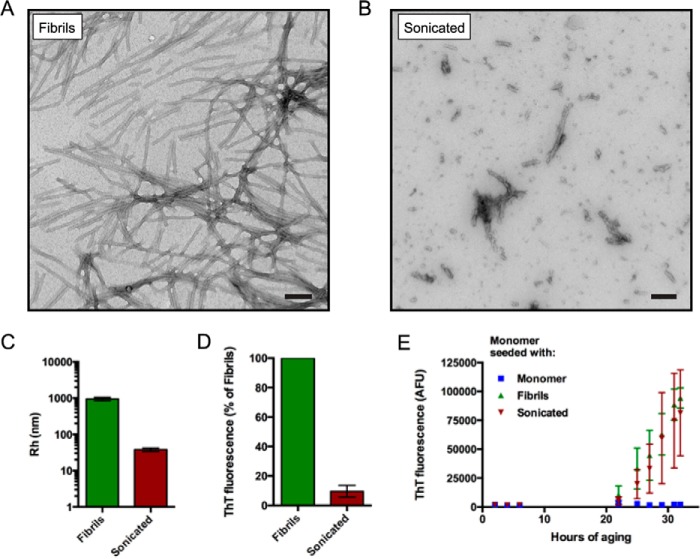
FIGURE 3.
Characterization of sonicated and non-sonicated αSyn fibrils. A and B, representative electron micrographs of αSyn aggregated at 2 mg/ml for 5 days under nutation before (A) and after (B) sonication. Sonicated fibrils contained a heterogeneous mixture of species including spherical oligomers and short fibril fragments. Scale bars, 100 nm. C, hydrodynamic radii (Rh) of fibrils and sonicated fibrils as measured by dynamic light scattering. Error bars, S.E. of three and seven replicates for fibrils and sonicated fibrils, respectively. D, background-subtracted fluorescence values of 2.5 μm (based on starting monomer concentration) fibrillar and sonicated αSyn fibrils in the presence of 10 μm ThT expressed as a percentage of signal obtained for fibrillar αSyn. Sonicated fibrils fluoresced with ∼10% of the intensity of fibrils. Error bars, S.D. of three independent experiments. E, an example aggregation time course of 7 μm monomeric αSyn seeded with 1 mol % of fibrillar, sonicated, or additional monomeric αSyn is shown. Sonicated and non-sonicated fibrils accelerated the aggregation of monomeric αSyn compared with additional monomeric αSyn. In this experiment, monomer-seeded αSyn was observed to acquire ThT positivity after 40 h of aging. 100,000 AFU represents the upper limit of detection of our instrument. Error bars, S.D. of 3–4 replicates. Similar data were obtained in three other independent experiments.

