
FIGURE 6.
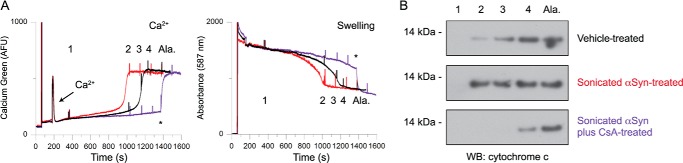
αSyn-induced changes in Ca2+ flux and swelling are due to mPTP activity and are accompanied by cytochrome c release. A, comparison of extramitochondrial Ca2+ fluorescence (left) and swelling (right) of mitochondria incubated with vehicle control (black), 1 μm sonicated αSyn fibrils (red), and 1 μm sonicated fibrils plus 1 μm CsA (purple). All experiments were conducted with the addition of 20 μm Ca2+ under complex I conditions. 30-μl aliquots were removed at the indicated times (1–4 and Ala) and were further processed for analysis in B. The addition of alamethicin is indicated by asterisks. Traces are representative of four independent experiments. B, aliquots removed from the mitochondrial suspensions at times noted in A were centrifuged at 14,000 × g for 5 min. The supernatants were run on SDS-PAGE, Western blotted, and probed with an antibody against cytochrome c to detect cytochrome c released from damaged mitochondria. Western blots are representative of four independent experiments.