FIGURE 4.
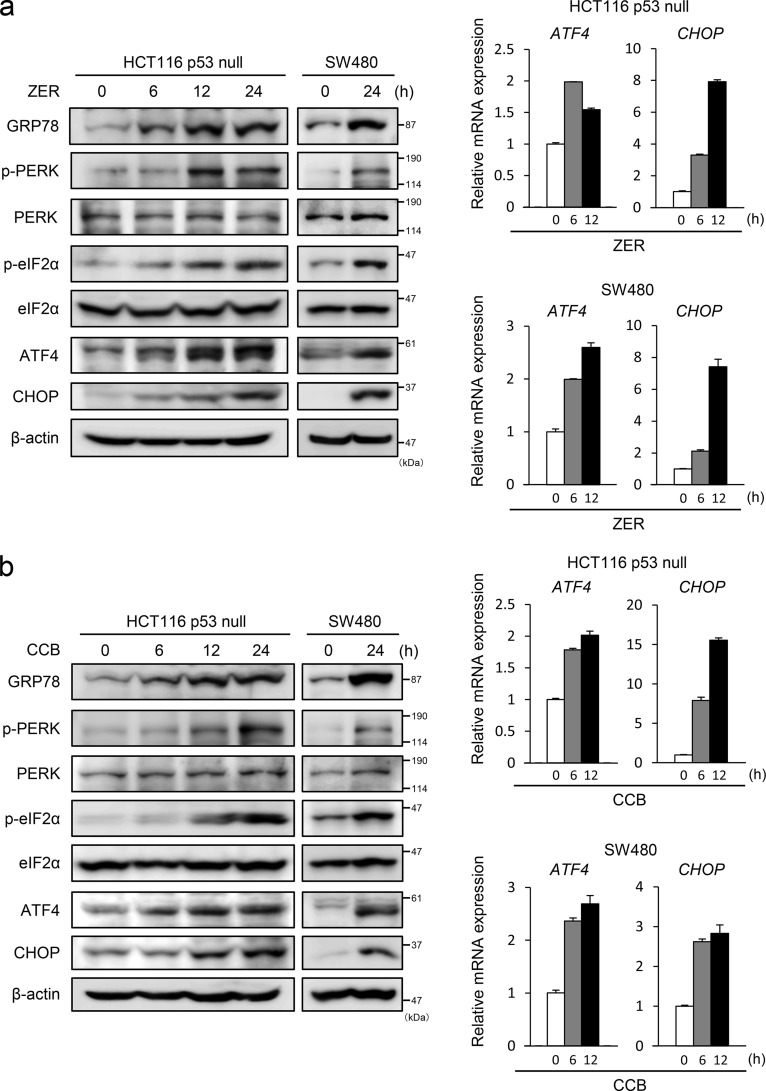
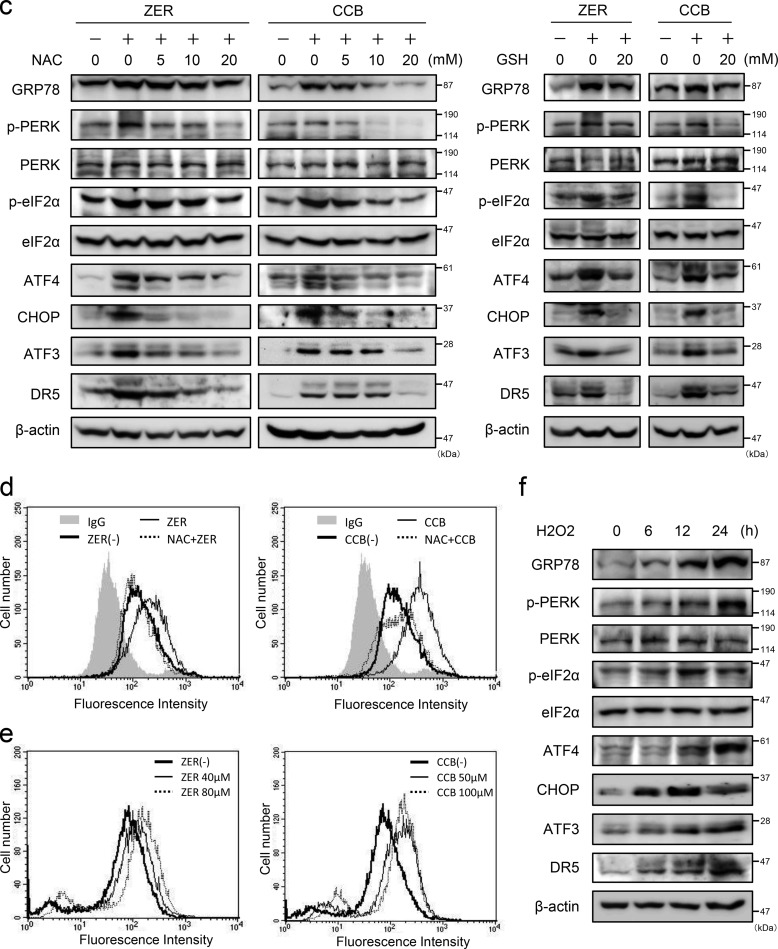
The UPR is activated by ZER and CCB, and ROS scavengers inhibit it activation and cell surface expression of DR5. HCT116-p53null cells or SW480 cells were treated with 20 μm ZER (a) or 50 μm CCB (b) for the indicated times, and the expression of GRP78, PERK, eIF2α, ATF4, and CHOP proteins was examined by Western blotting. β-actin was used as a loading control (left panel). ATF4 and CHOP mRNAs were also measured by qRT-PCR and normalized to GAPDH (right panel). c, HCT116-p53null cells were incubated with the indicated concentrations of NAC (left panel) or GSH (right panel) for 1 h, followed by ZER or CCB treatment. Cell extracts were assayed as in a. d, cell surface expression of DR5 of NAC-treated HCT116-p53null cells was measured following treatment with 20 μm ZER (left panel) or 50 μm CCB (right panel) for 24 h as under “Experimental Procedures.” Shaded no line, vehicle with control IgG; thick line, vehicle with anti-DR5 antibody; thin line, ZER or CCB of control cells with anti-DR5 antibody; dashed line, ZER or CCB of NAC-treated cells with anti-DR5 antibody. e, after treatment with the indicated concentrations of ZER (left panel) or CCB (right panel) for 24 h, HCT116-p53null cells were labeled with 2′,7′-dichlorodihydrofluorescein diacetate, and intracellular ROS levels were measured by flow cytometry. f, HCT116-p53null cells were incubated with 0.2 mm H2O2 for 30 min, and then cells were collected at the indicated time points and assayed as in a.


