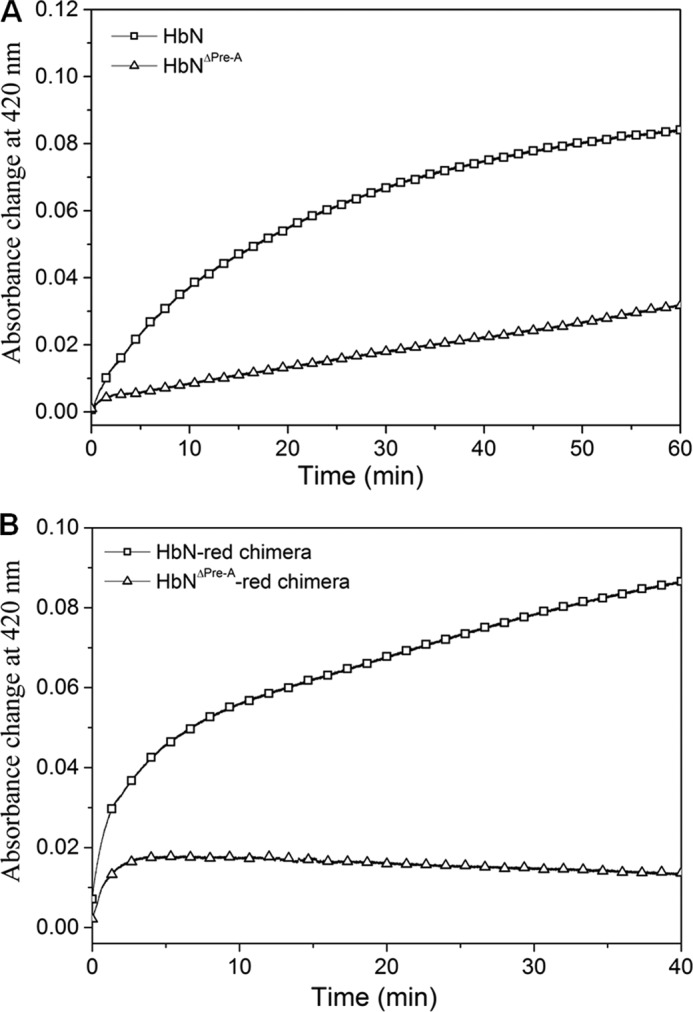
FIGURE 8.

Reduction profile of (A) wild type and Pre-A mutant of HbN by FdR and (B) autoreduction of HbN-FdR and HbNΔPre-A-FdR chimeras. The graph depicts the efficiency of wild type and mutant HbN reduction as recorded by the increase in the absorbance at 420 nm (Soret peak) due to the formation of the CO-adduct after conversion of oxidized HbN into the reduced state of MtbHbN and Pre-A-deleted HbN (HbNΔPre-A) (A) and HbN-FdR chimera and Pre-A deleted HbN-FdR chimera (HbNΔPre-A-red) (B).
