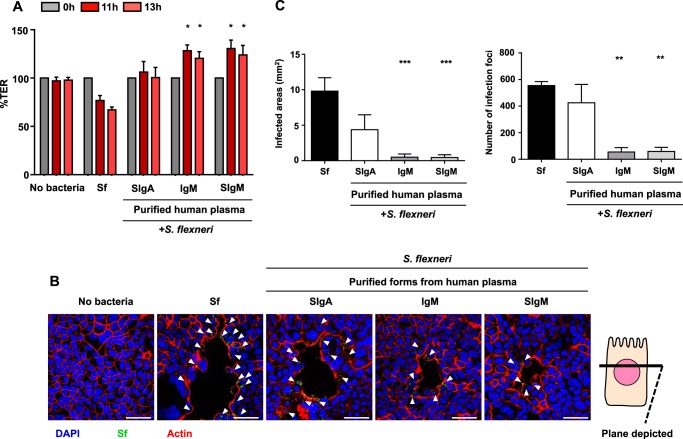
FIGURE 5.
Integrity of Caco-2 cell monolayers infected with S. flexneri alone or in combination with human plasma-derived IgM/SIgM. A, TER of Caco-2 cell monolayers exposed O/N to S. flexneri alone or associated with human IgM, reconstituted SIgM, and plasma-derived SIgA (control), as determined at three time points. The TER values for each condition and each time point were normalized to the TER values at time 0 and are expressed as percentages. Data are a pool of two independent experiments (n = 4). Significant statistical differences were calculated by comparison with the condition Sf. *, p < 0.05. B, LSCM pictures (snapshots) of transversal sections obtained along the x axis of Caco-2 cell monolayers exposed O/N to S. flexneri alone or in complex with IgM, SigM, or SIgA. Actin fibers are visualized by phalloidin labeling (red), Caco-2 cells are visualized via nuclear staining with DAPI (blue), and bacteria constitutively expressing GFP stained green. Arrowheads indicate the loci of dense S. flexneri. Scale bar = 50 μm. C and D, for quantitative analysis, the sum of infected areas (C) and the number of infection foci (D) were determined from LSCM pictures of whole filters using ImageJ software. When obtained, significant statistical differences were calculated by comparison with the condition Sf. **, p < 0.005; ***, p < 0.001. The data in C and D are a pool of two independent experiments (n = 4 or 5).

